MARKET INSIGHT
A deep dive look into the sectors
Select a Sector
Industry Pharmaceuticals & Biotech
MARKET INSIGHT
Segment Rational
RATIONAL
The Pharmaceuticals and Biopharma industries are expected to benefit from the ambitious healthcare transformation program and the government’s commitment to support local capabilities through local content policies. The Kingdom is the largest market in the region in 2020. The biopharma industry is still growing globally, and the majority of players are small sized highly specialized companies. The Kingdom has an opportunity to develop the Biopharma industry at early stages to cement its role and leadership in the region and leverage its current local capabilities in the conventional pharmaceuticals through vertical integration toward higher value-added segments. Finally, as ever-evolving global scenarios threaten supply chain integrity, essential medicine, and products of national importance (e.g., vaccines, blood) are critical to ensure sustainable supply for the Kingdom.
Segment Trends and Value Proposition
SEGMENT TRENDS

Increasing acceptance of Biologics/ Biosimilars.

Innovative R&D in new developing technology areas.

Industry consolidation, and focus on contract manufacturing organization & contract (development) manufacturing organizations.

Heightened need for supply chain resilience.

Investing in digital medical innovations & medical data.
Value Proposition
• The Kingdom’s Pharmaceuticals market reached SAR 27.9 bn in 2020.
• KSA is expected to be the largest consumer of biologic drugs in the region, currently 75% of Pharmaceuticals are imported.
• The local market is expected to reach SAR 44.1 bn by 2030.
• Benefit from the ambitious healthcare transformation program and the government’s commitment to support local capabilities through local content policies.
Segment Value Chain

Global Pharmaceuticals Market Size

• Biopharma are increasingly being adopted globally, while the MEA region is expected to remain reliant on Conventional Pharma.
• Biopharma is forecasted to increase its global market share from ~32% in 2020, to ~36% by 2028.
• Conventional Pharma growth rates are expected to decline in response to global pharmaceutical companies shift of focus towards Biopharma (e.g. 2.2% in Conv. Pharma vs. 4.4% growth in Biopharma).
Global Biopharma, Patented Vs. Biosimilars

• Currently, biosimilars constitute a limited share of the Biologics market with 7%, however, witnessing high growth rate due to continued introduction of off-patent large molecules.
• Biosimilars will continue to grow at a higher rate than patented Biologics, reaching ~16% of total Biopharma market in 2029 (USD 78.8 Bn) .
Global Market for Biosimilars

Biosimilars Main Therapeutic Areas

Global Biomanufacturing Technology

• Chronic disease: Increase of non-communicable disease due to aging population presents opportunity for biotechnology to improve on early diagnosis and treatment.
• Personalized medicine: Increase in gene and immuno-therapy to enhance a patient’s inherent ability to fight disease with improved outcomes and fewer side-effects.
• Value based payments: Healthcare reforms leading to decreasing reimbursements resulting in alternative outcome-based payment model being implemented with payers.
• Competitor partnerships: Increased prevalence of innovation through partnering, enabling organizations to focus on key strengths and minimize costs.
Global R&D Spend

• Between 1998 and 2008, high Pharma productivity drove strong growth in global R&D spend.
• Between 2008 and 2018, portfolio rationalization by large Pharma companies limited R&D growth following patent cliff; however, Biotech remained strong.
• Following 2018, Pharma companies focused more on investments to improve future R&D efficiencies such as using real world big data combined with machine learning techniques to be purpose oriented.
MEA Pharmaceuticals Market Size

• Regional market is highly dependent on Conv. Pharma, with lower adoption of Biopharma due to the higher cost sensitivity for related products.
• Generics is considered to be the next focus of interest for MEA region with higher adoption rates expected till 2028 (~5.6% CAGR).
Top Regional Importers
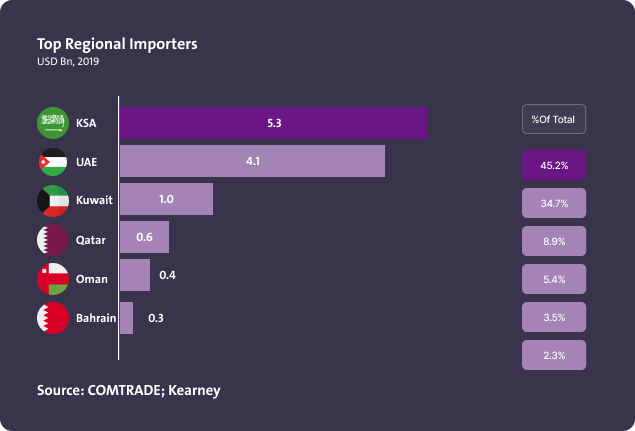
Key insights:
• KSA is the biggest importer in GCC, with almost half of the imports.
• UAE imports constitute ~1/3 of regional imports although UAE’s population is less than one-fifth of total regional population.
Top Exports to the GCC Region
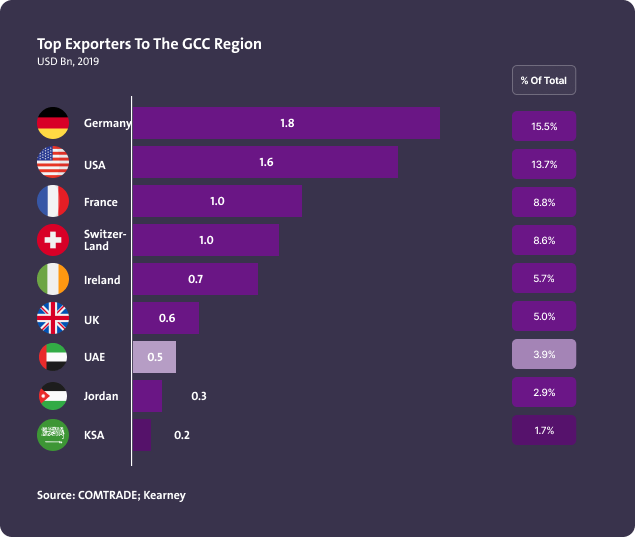
Key insights:
• Despite being the biggest importer, KSA exports less than 2% of total imports of GCC; which highlights significant room for improvement.
• Imports of the region is mainly covered by European countries.
Value of API Markets

• Margins of API producers are being reduced by pressure from formulators.
• API market is very competitive, with over 2000 producers globally.
• In China and India, merchant APIs is forecasted to be growing between 12% and 13% annually (2016-2025), outpacing Europe and US at 6-7%, supporting the trend of outsourcing to Asia Pacific.
• On the global level, 63% of all APIs are synthetic, and 28% is biotech.
Global CMO and FDF Market

The overall CMO market will grow with CAGR of 8 percent until 2023 and reach USD 145 bn; FDF market will follow a similar growth rate.
KSA Pharmaceuticals Market Size

KSA is expected to be the largest consumer of biologic drugs regionally, while local production is focused on generics F&F and secondary packaging.
Local Production VS. Government Procurement

Driven by government procurement, KSA’s local production has the potential to expand capabilities and enhance current localization levels.
KSA Pharmaceuticals Localization

• Majority of local production have limited capabilities with focus on packaging and conventional solid dosage forms mostly for generic drugs, with some CMO contracts for branded drugs.
• National shift of focus towards biotechnology is emphasized by national initiatives to build an enabling infrastructure.
KSA Conventional Pharma

Key insights:
• Generic drugs and patented drugs have each 50% share in KSA conventional market, and expected to retain even shares to reach an overall market size of USD 7.7 Bn by 2029.
• Global trend towards the development of biologics drugs will affect the growth rate of conventional pharma, which will decrease over the next decade.
KSA Biopharma

Key insights:
• Biosimilars constitute a small share of Biologics market with ~5%; however, are expected to grow at a higher rate than patented biologics to reach ~7% of total market by 2025.
• Biosimilars are expected to grow more than patented biologics due to increasing acceptance within Pharmaceutical industry and expiry of patents.
• The market is expected to grow at a more stable and conservative rate after 2025; with biosimilars and patented biologics having similar growth rates.
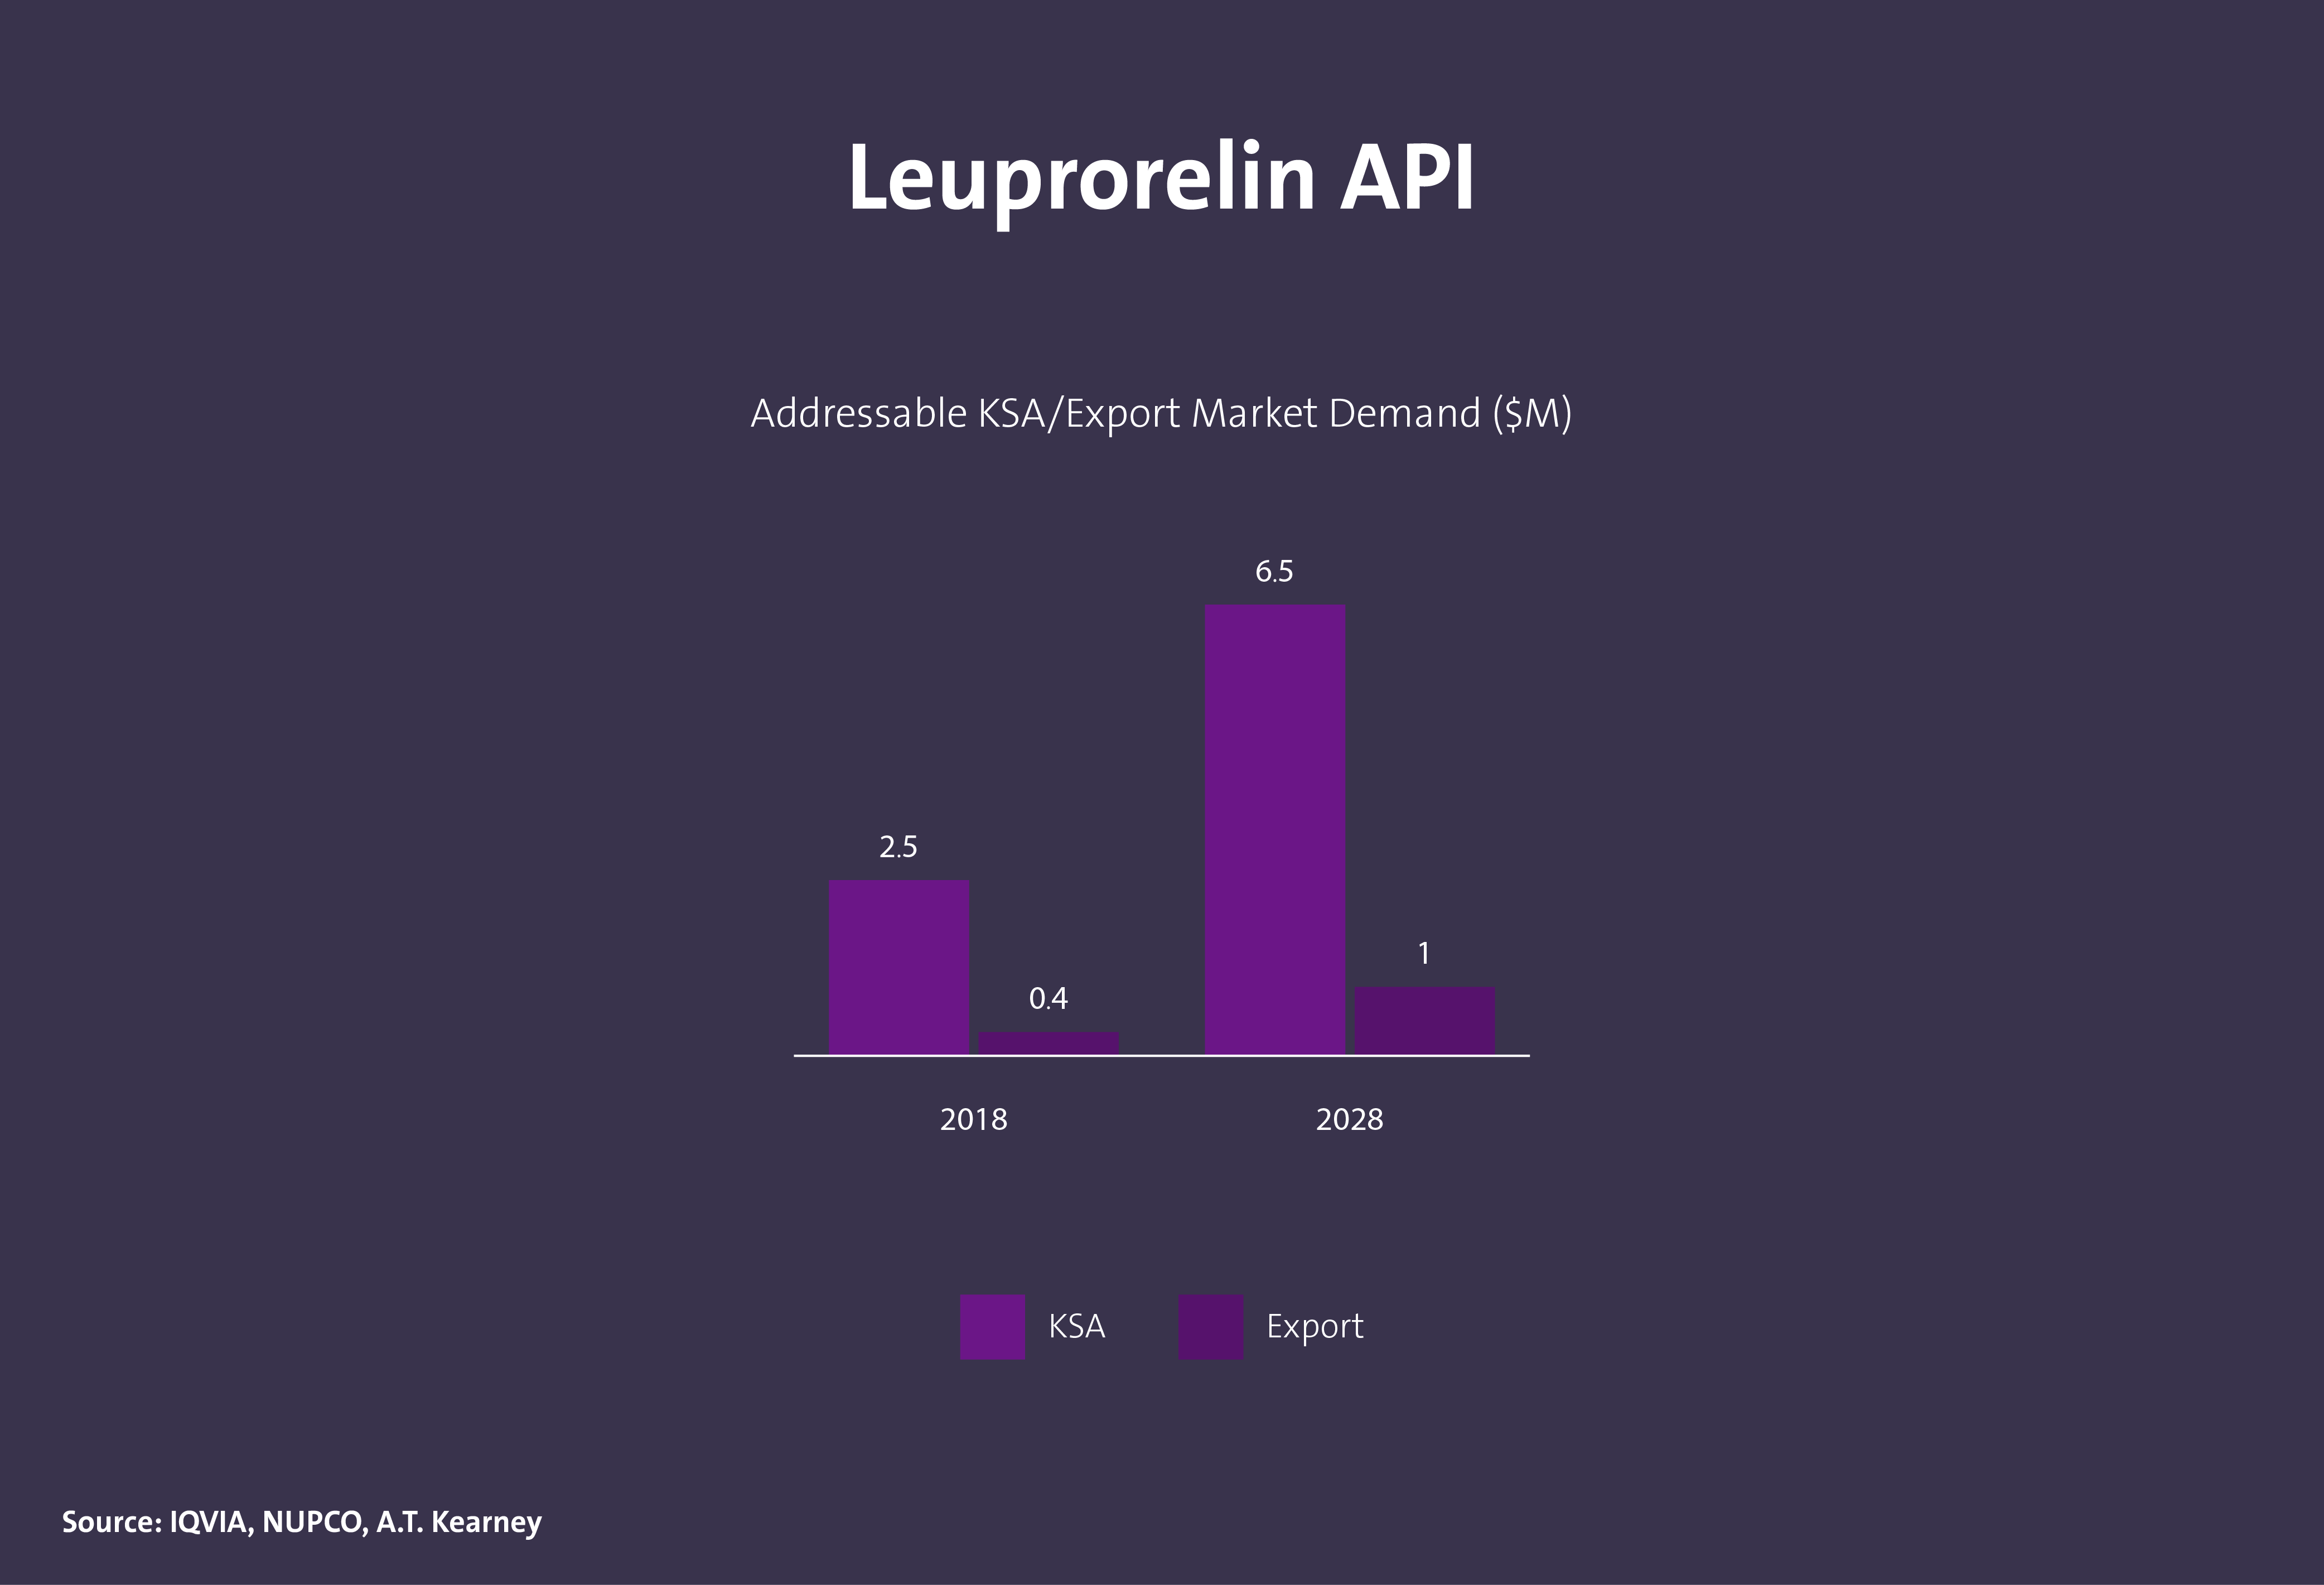
ACTIVE PHARMACEUTICAL INGREDIENT (API)
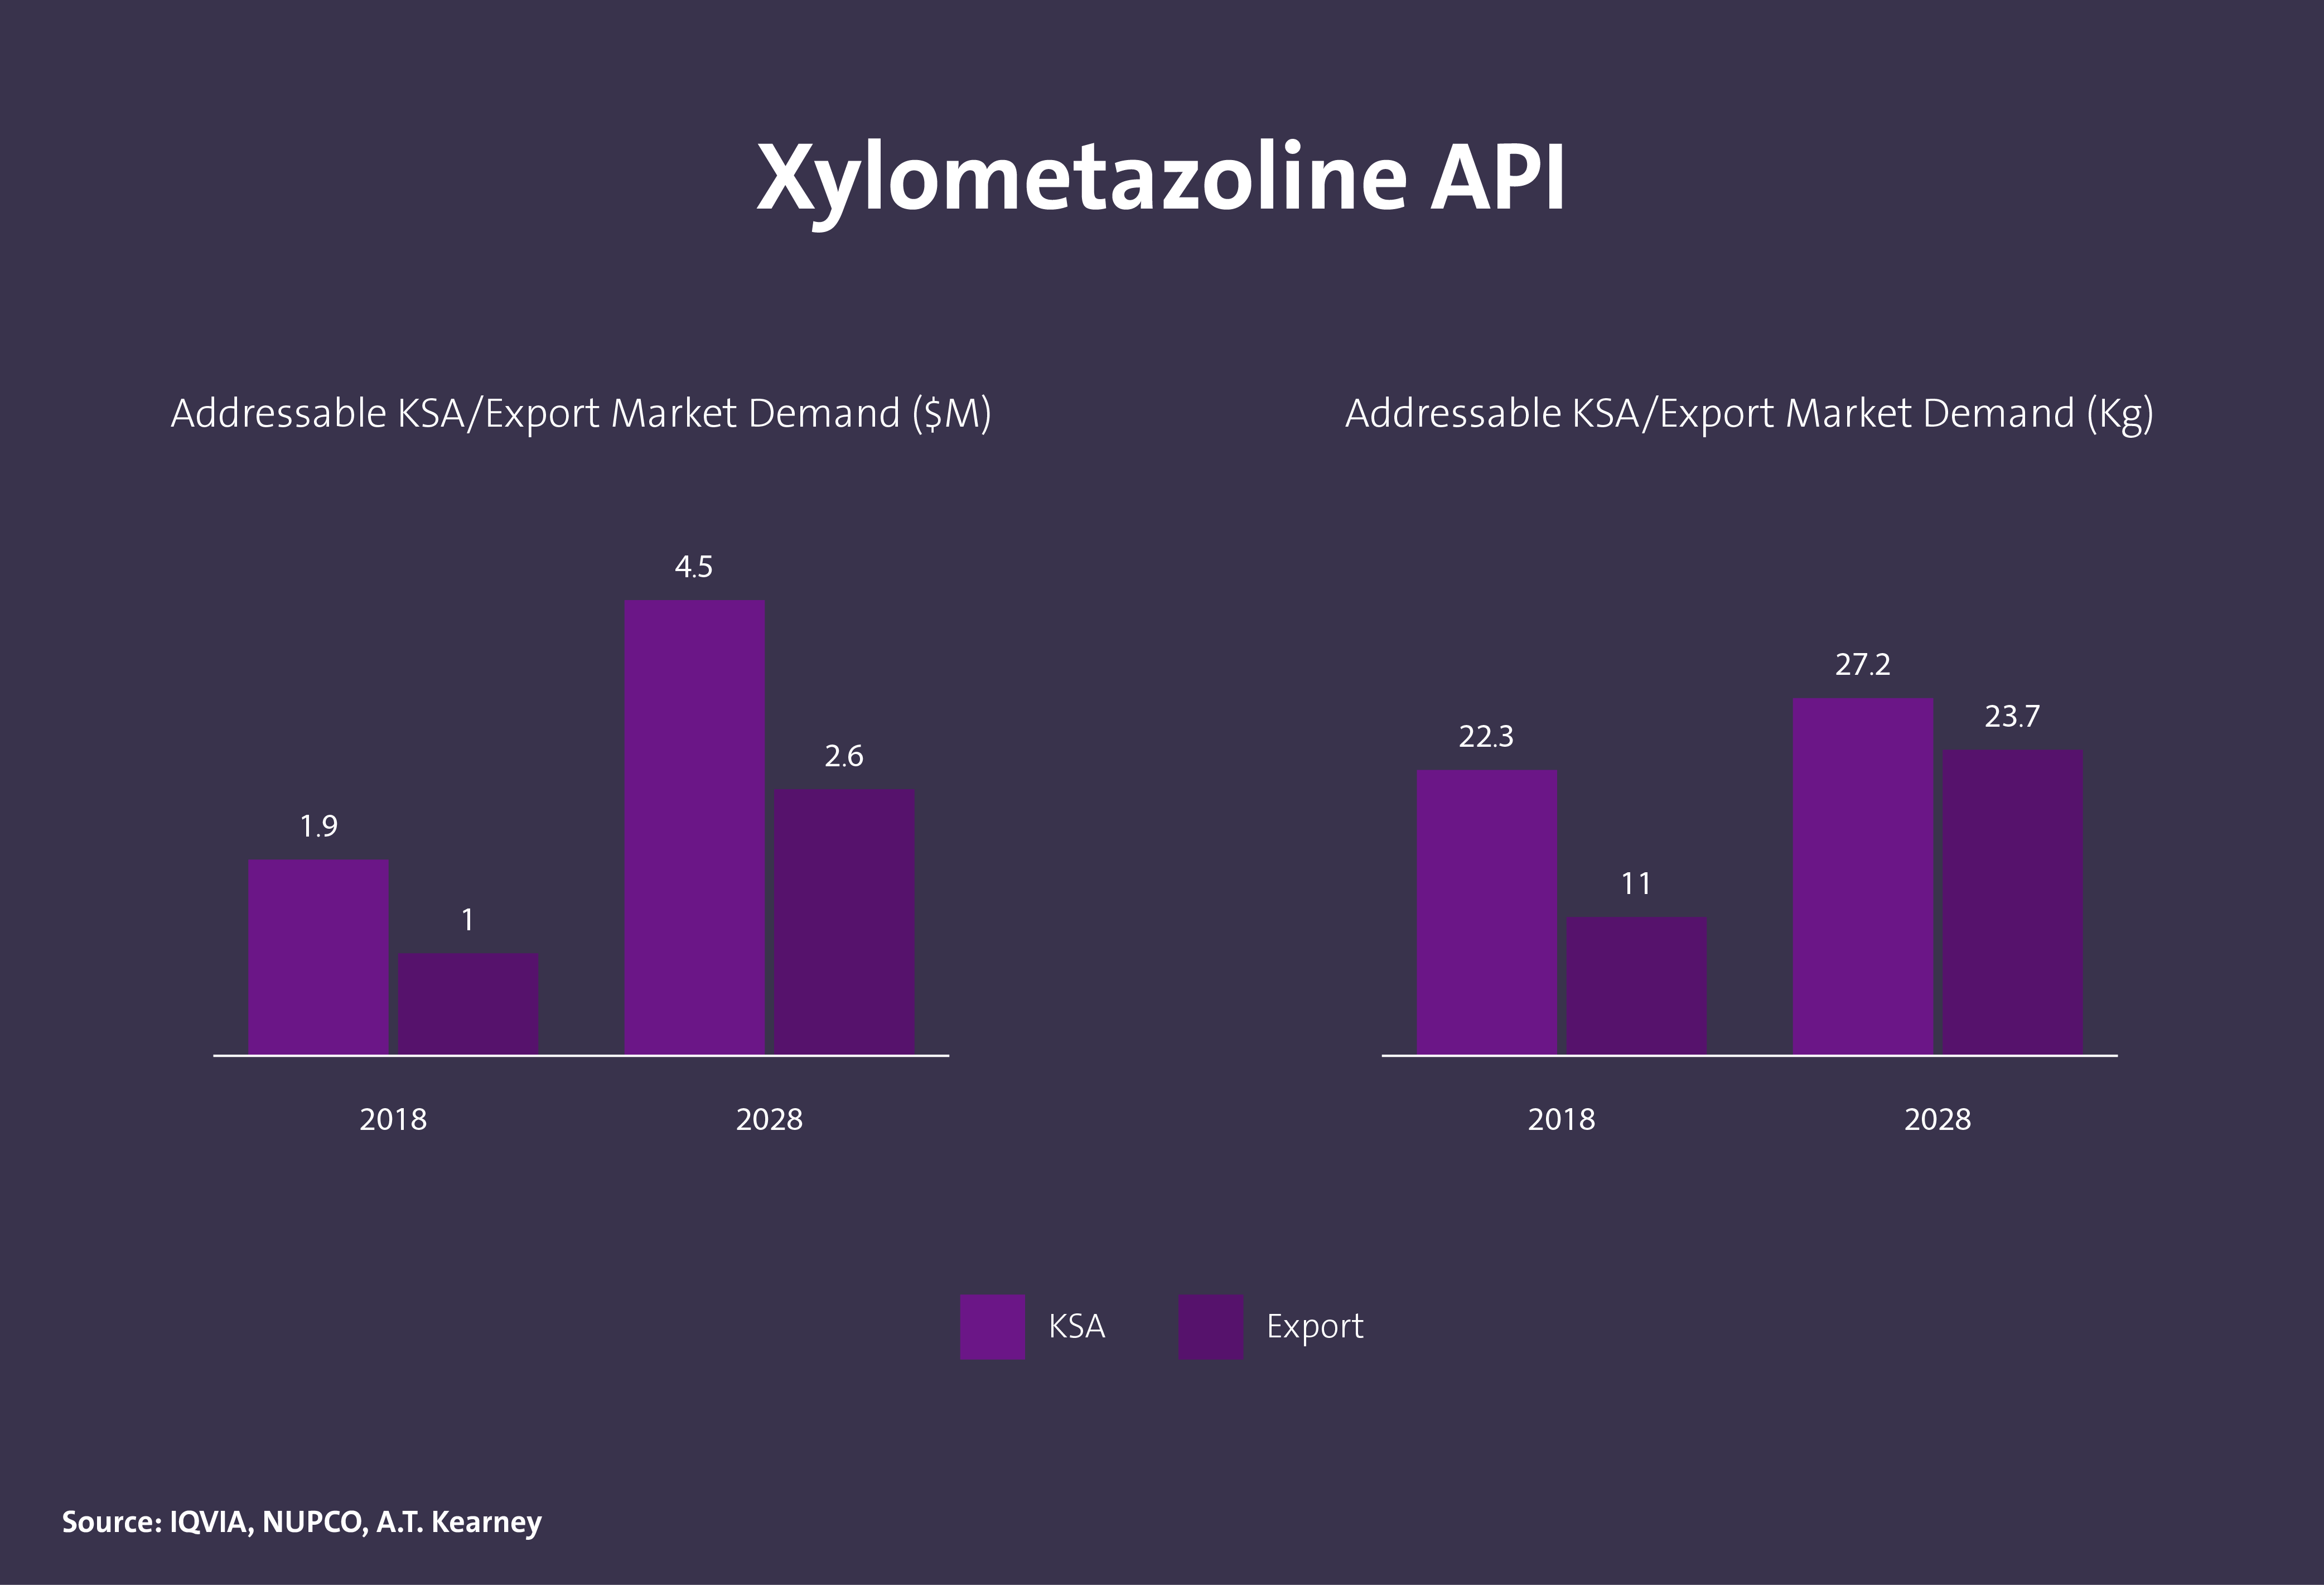
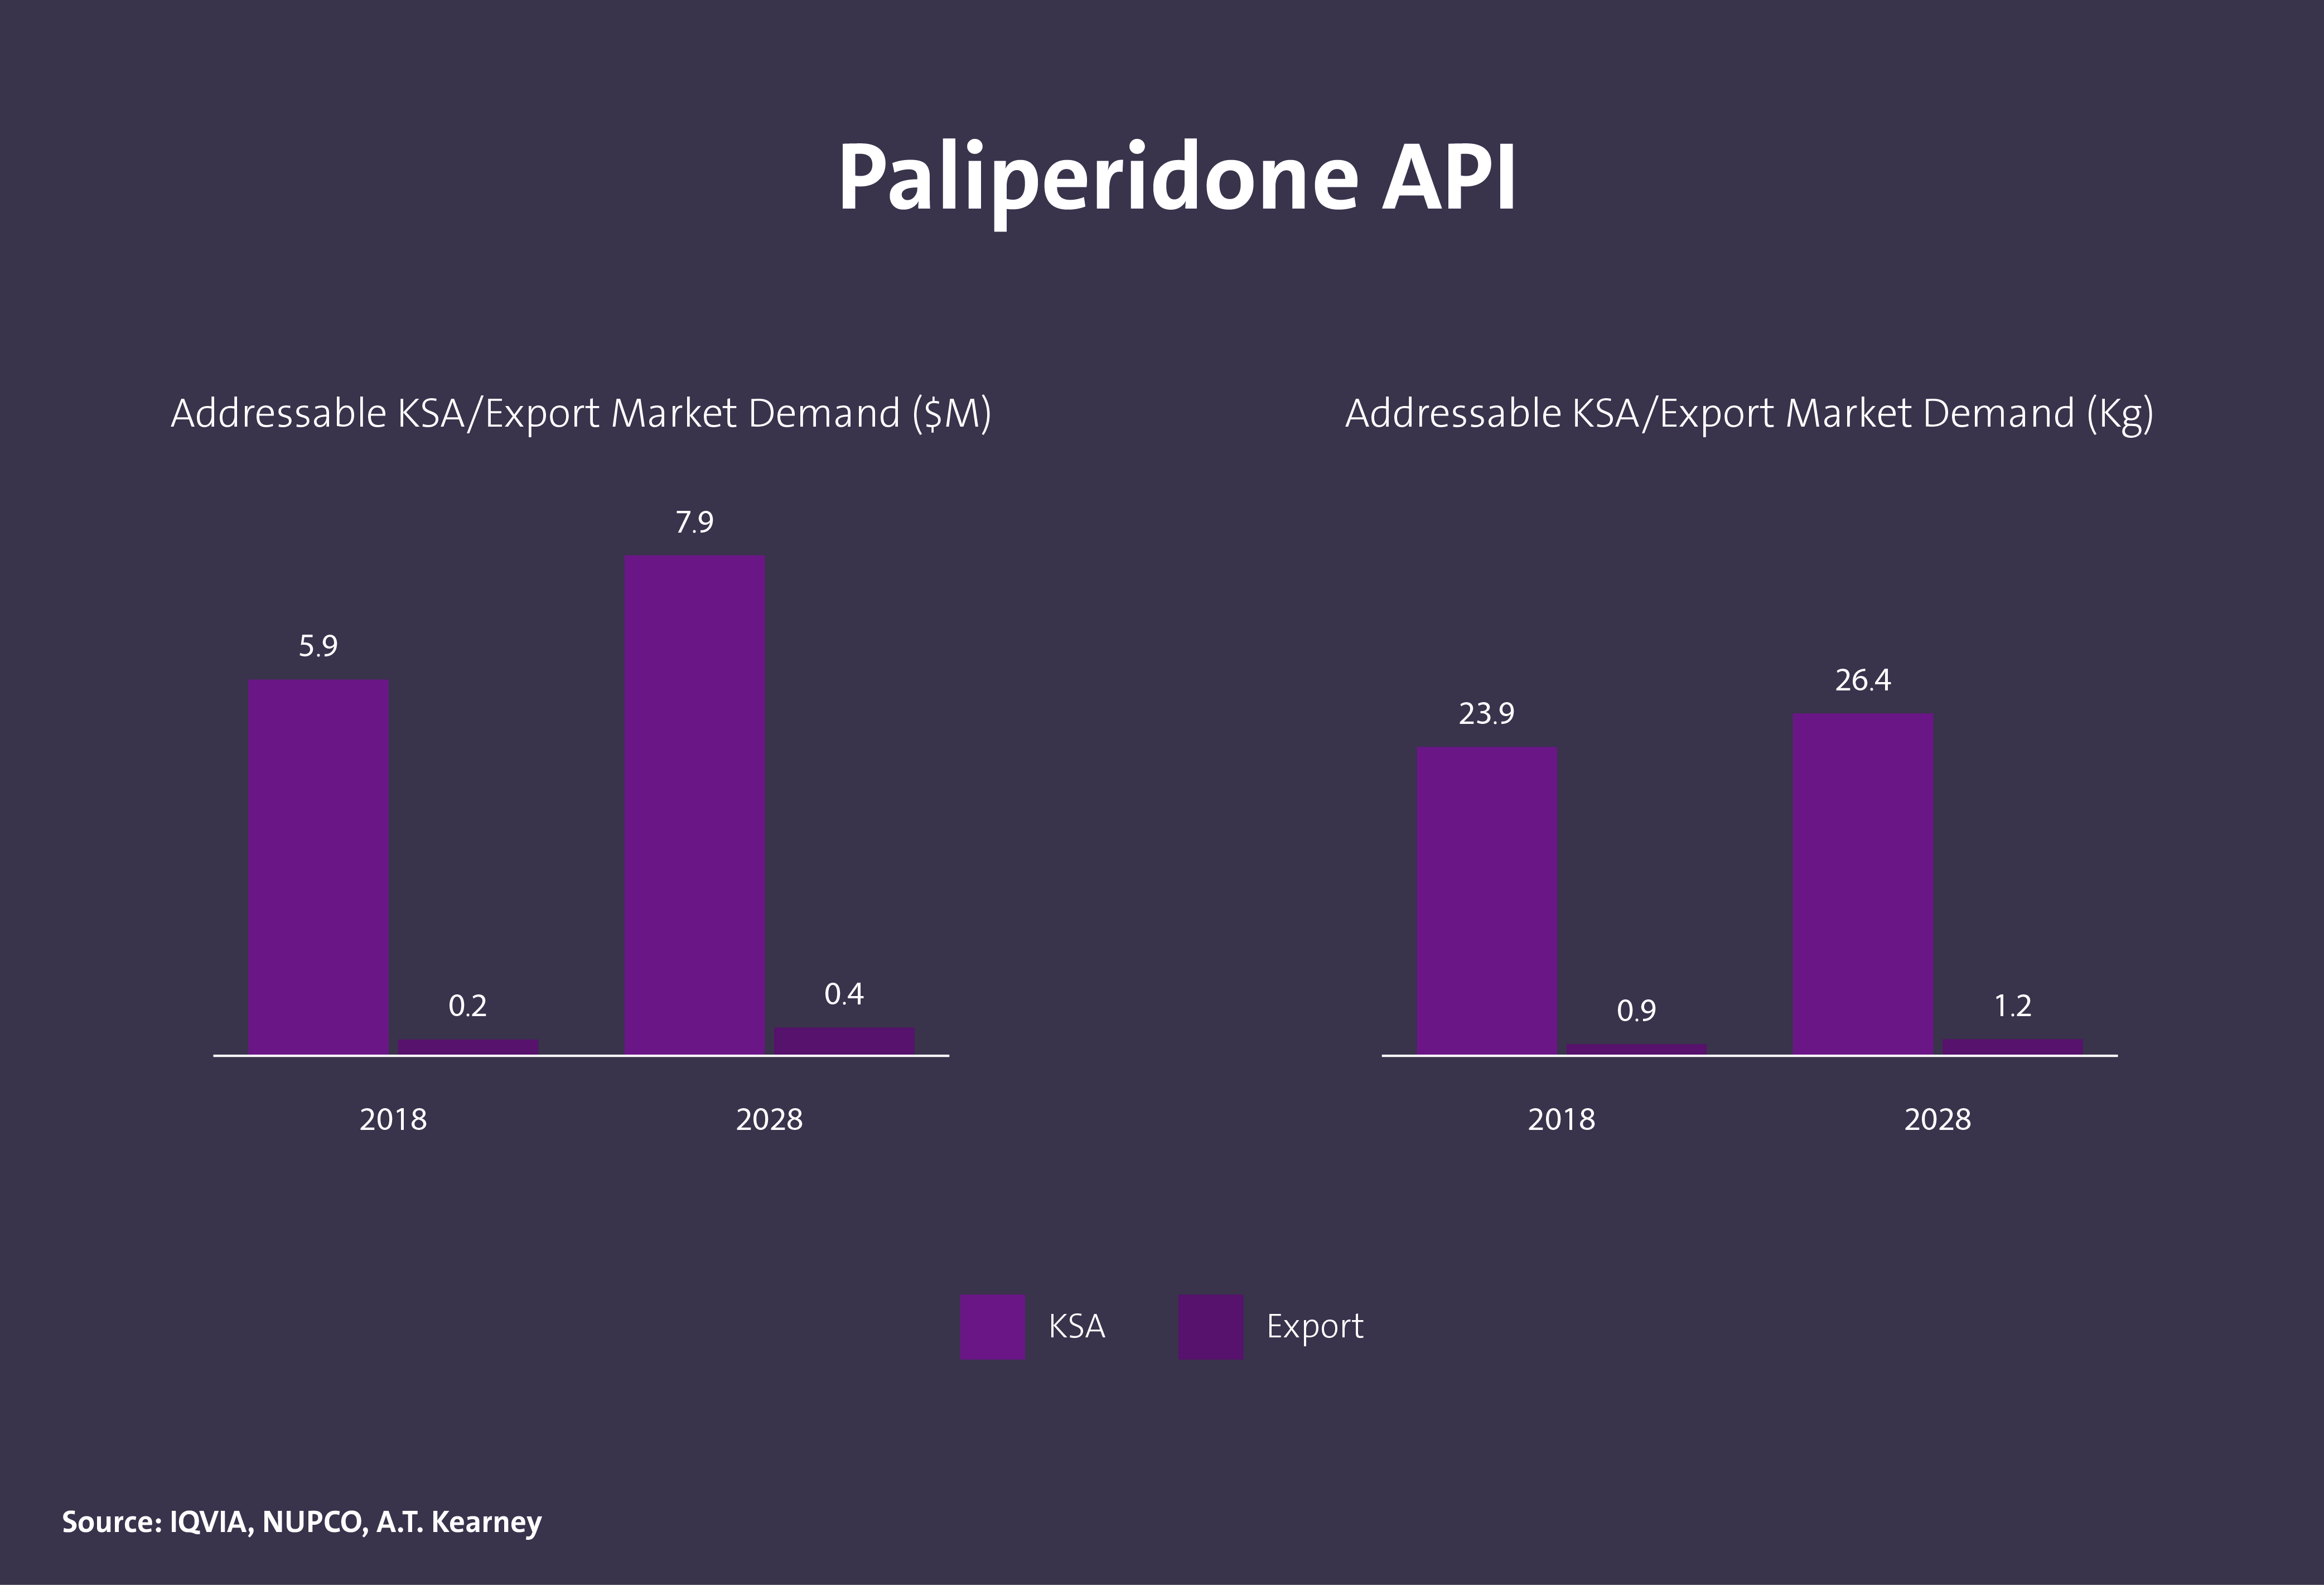
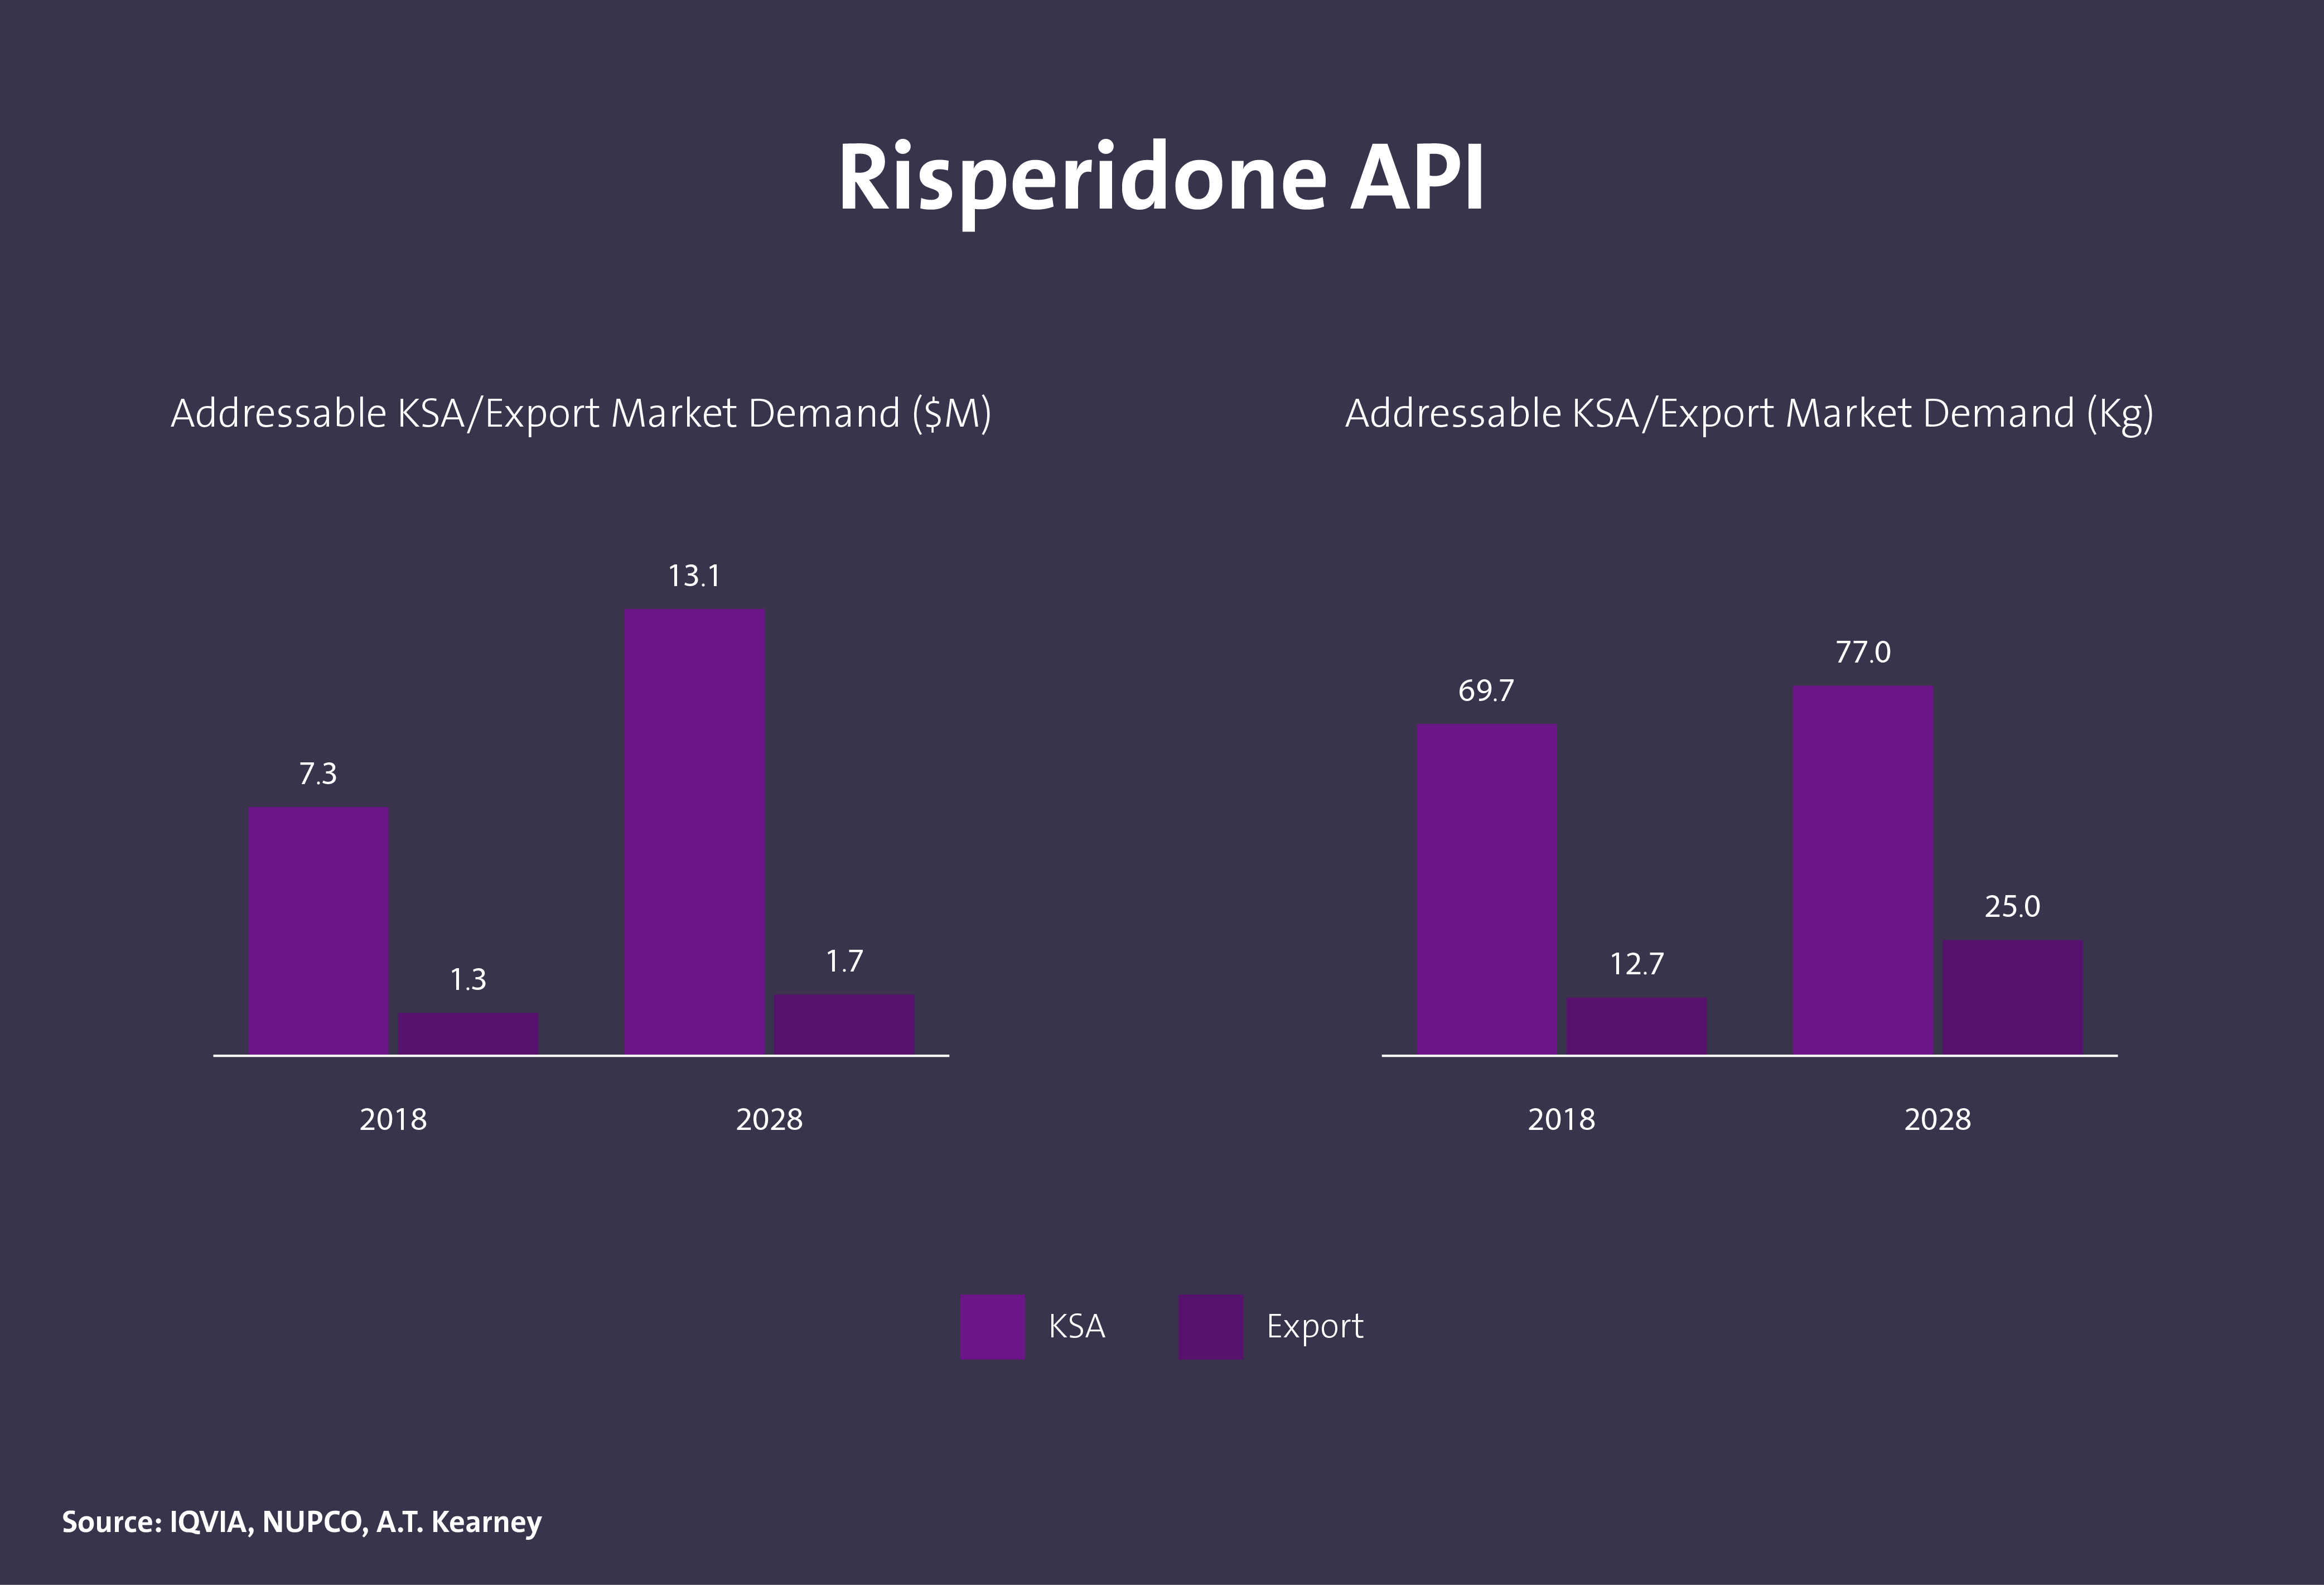
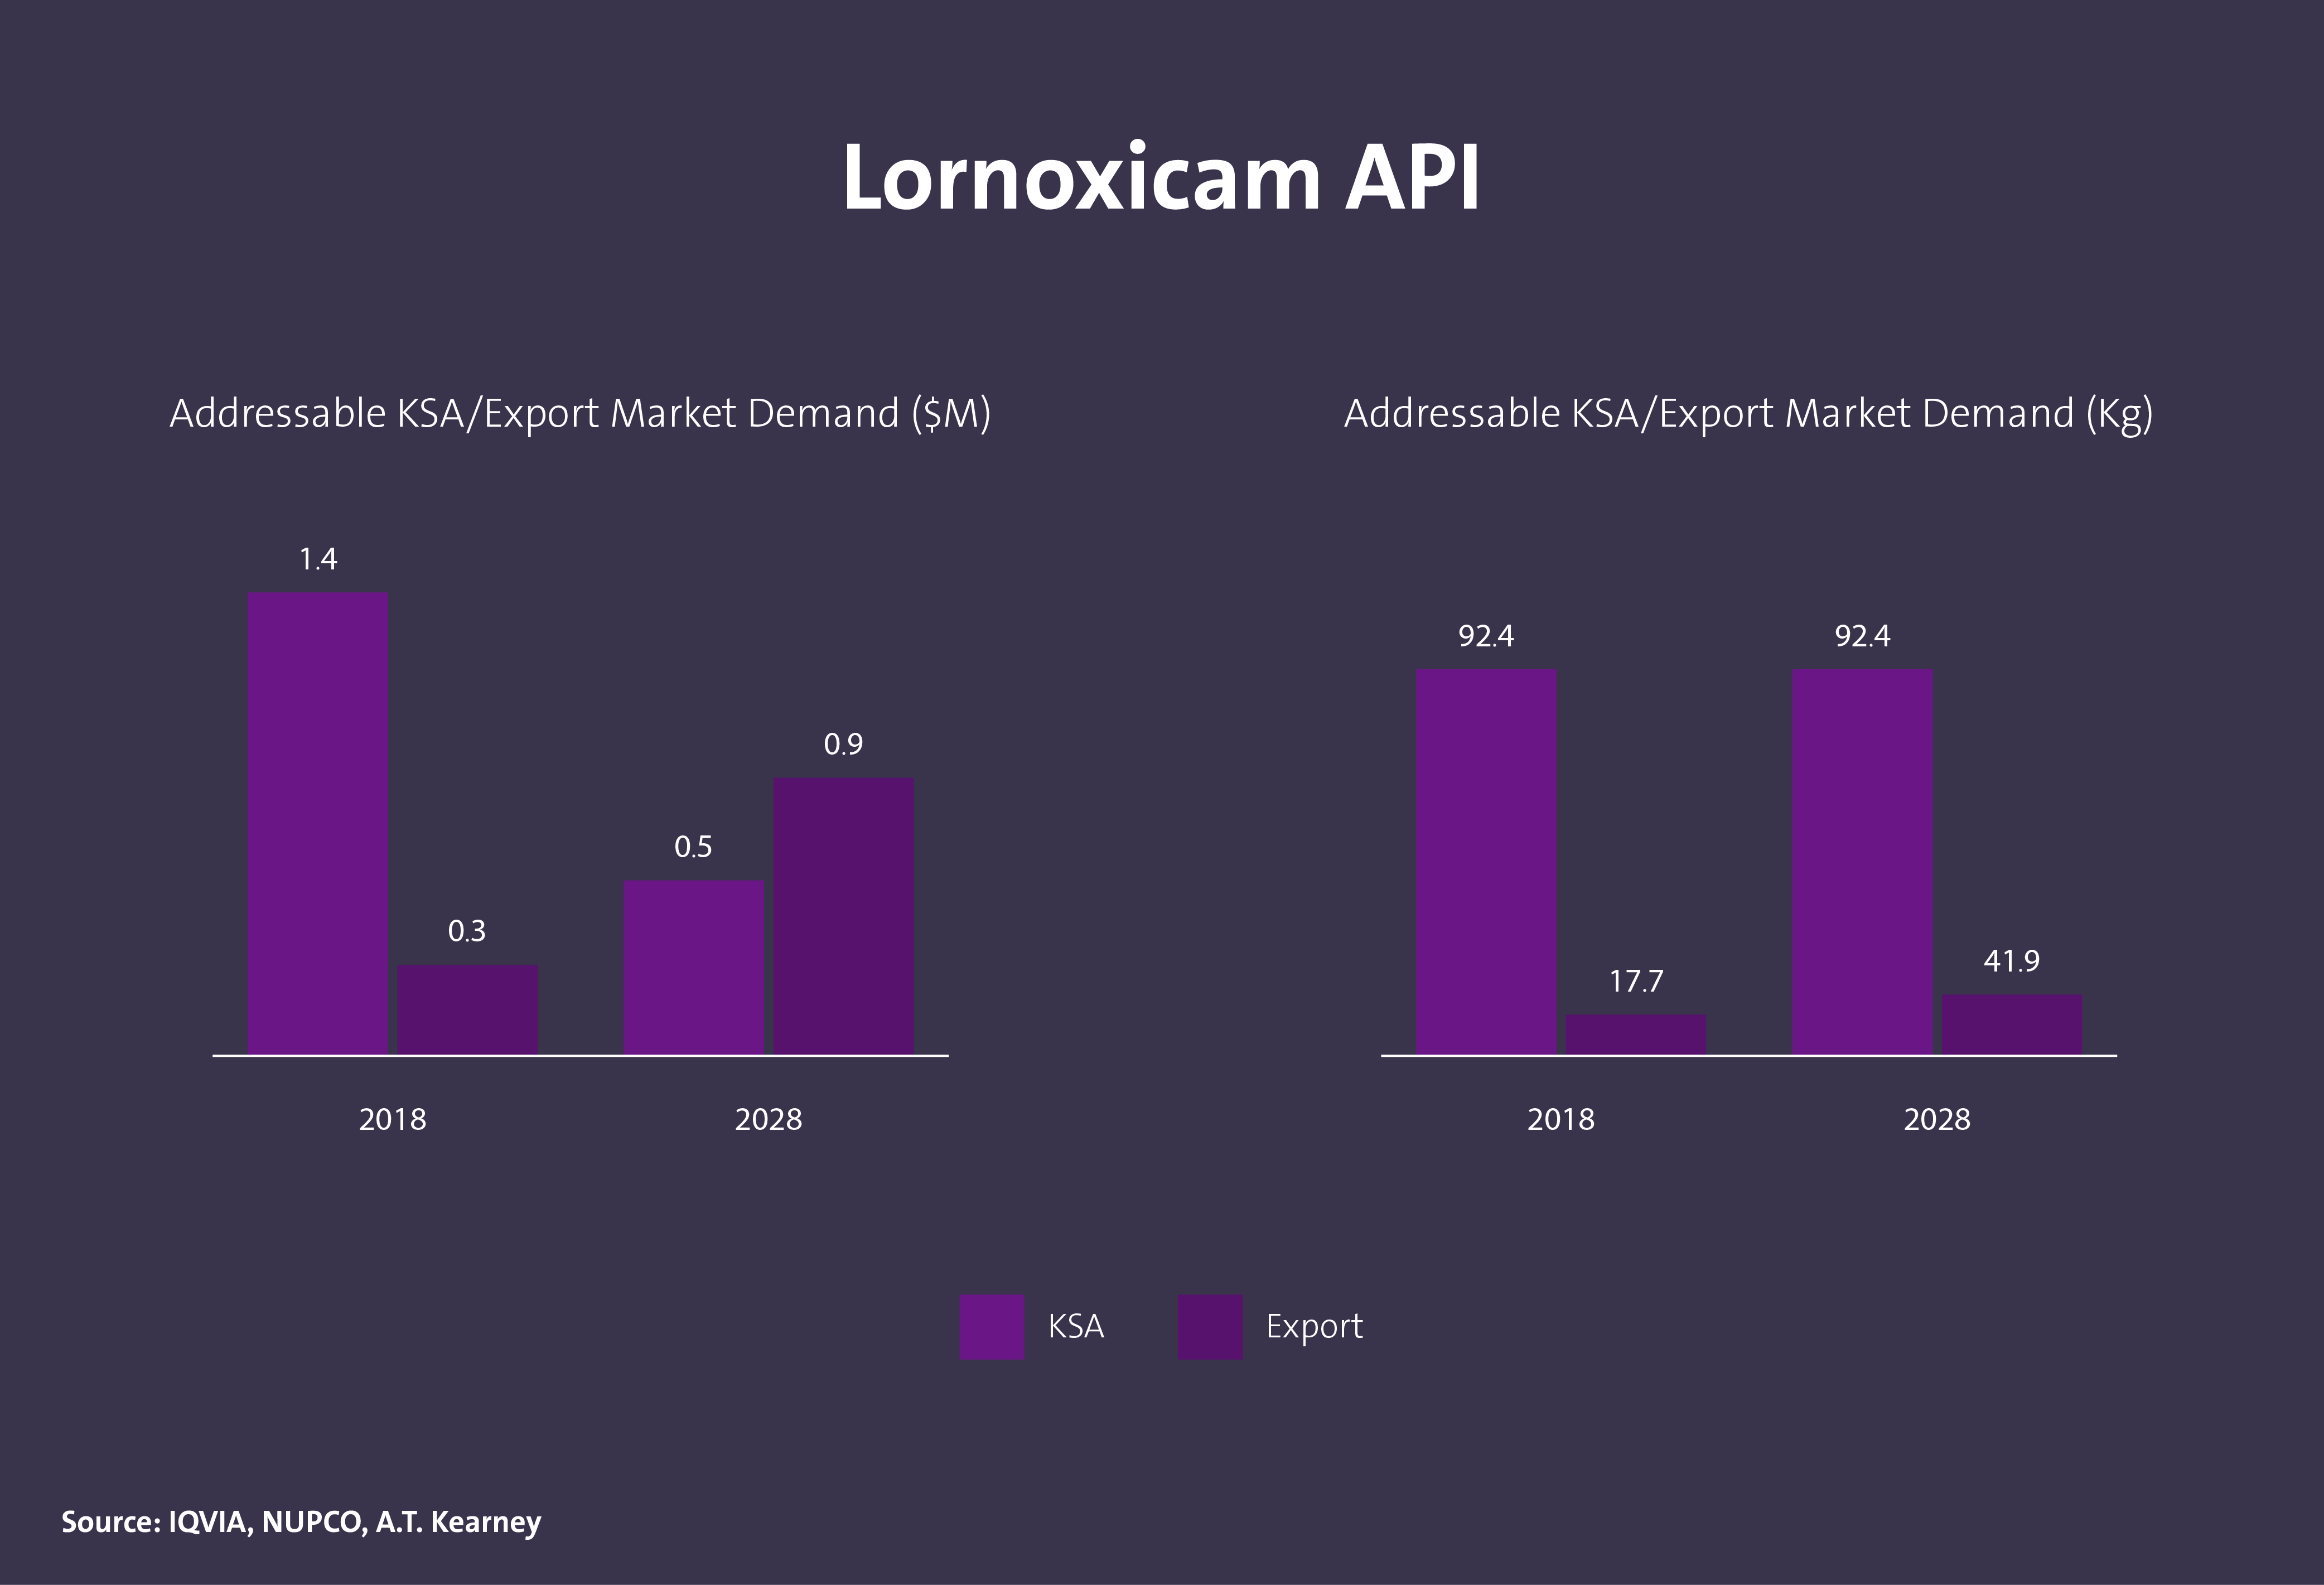
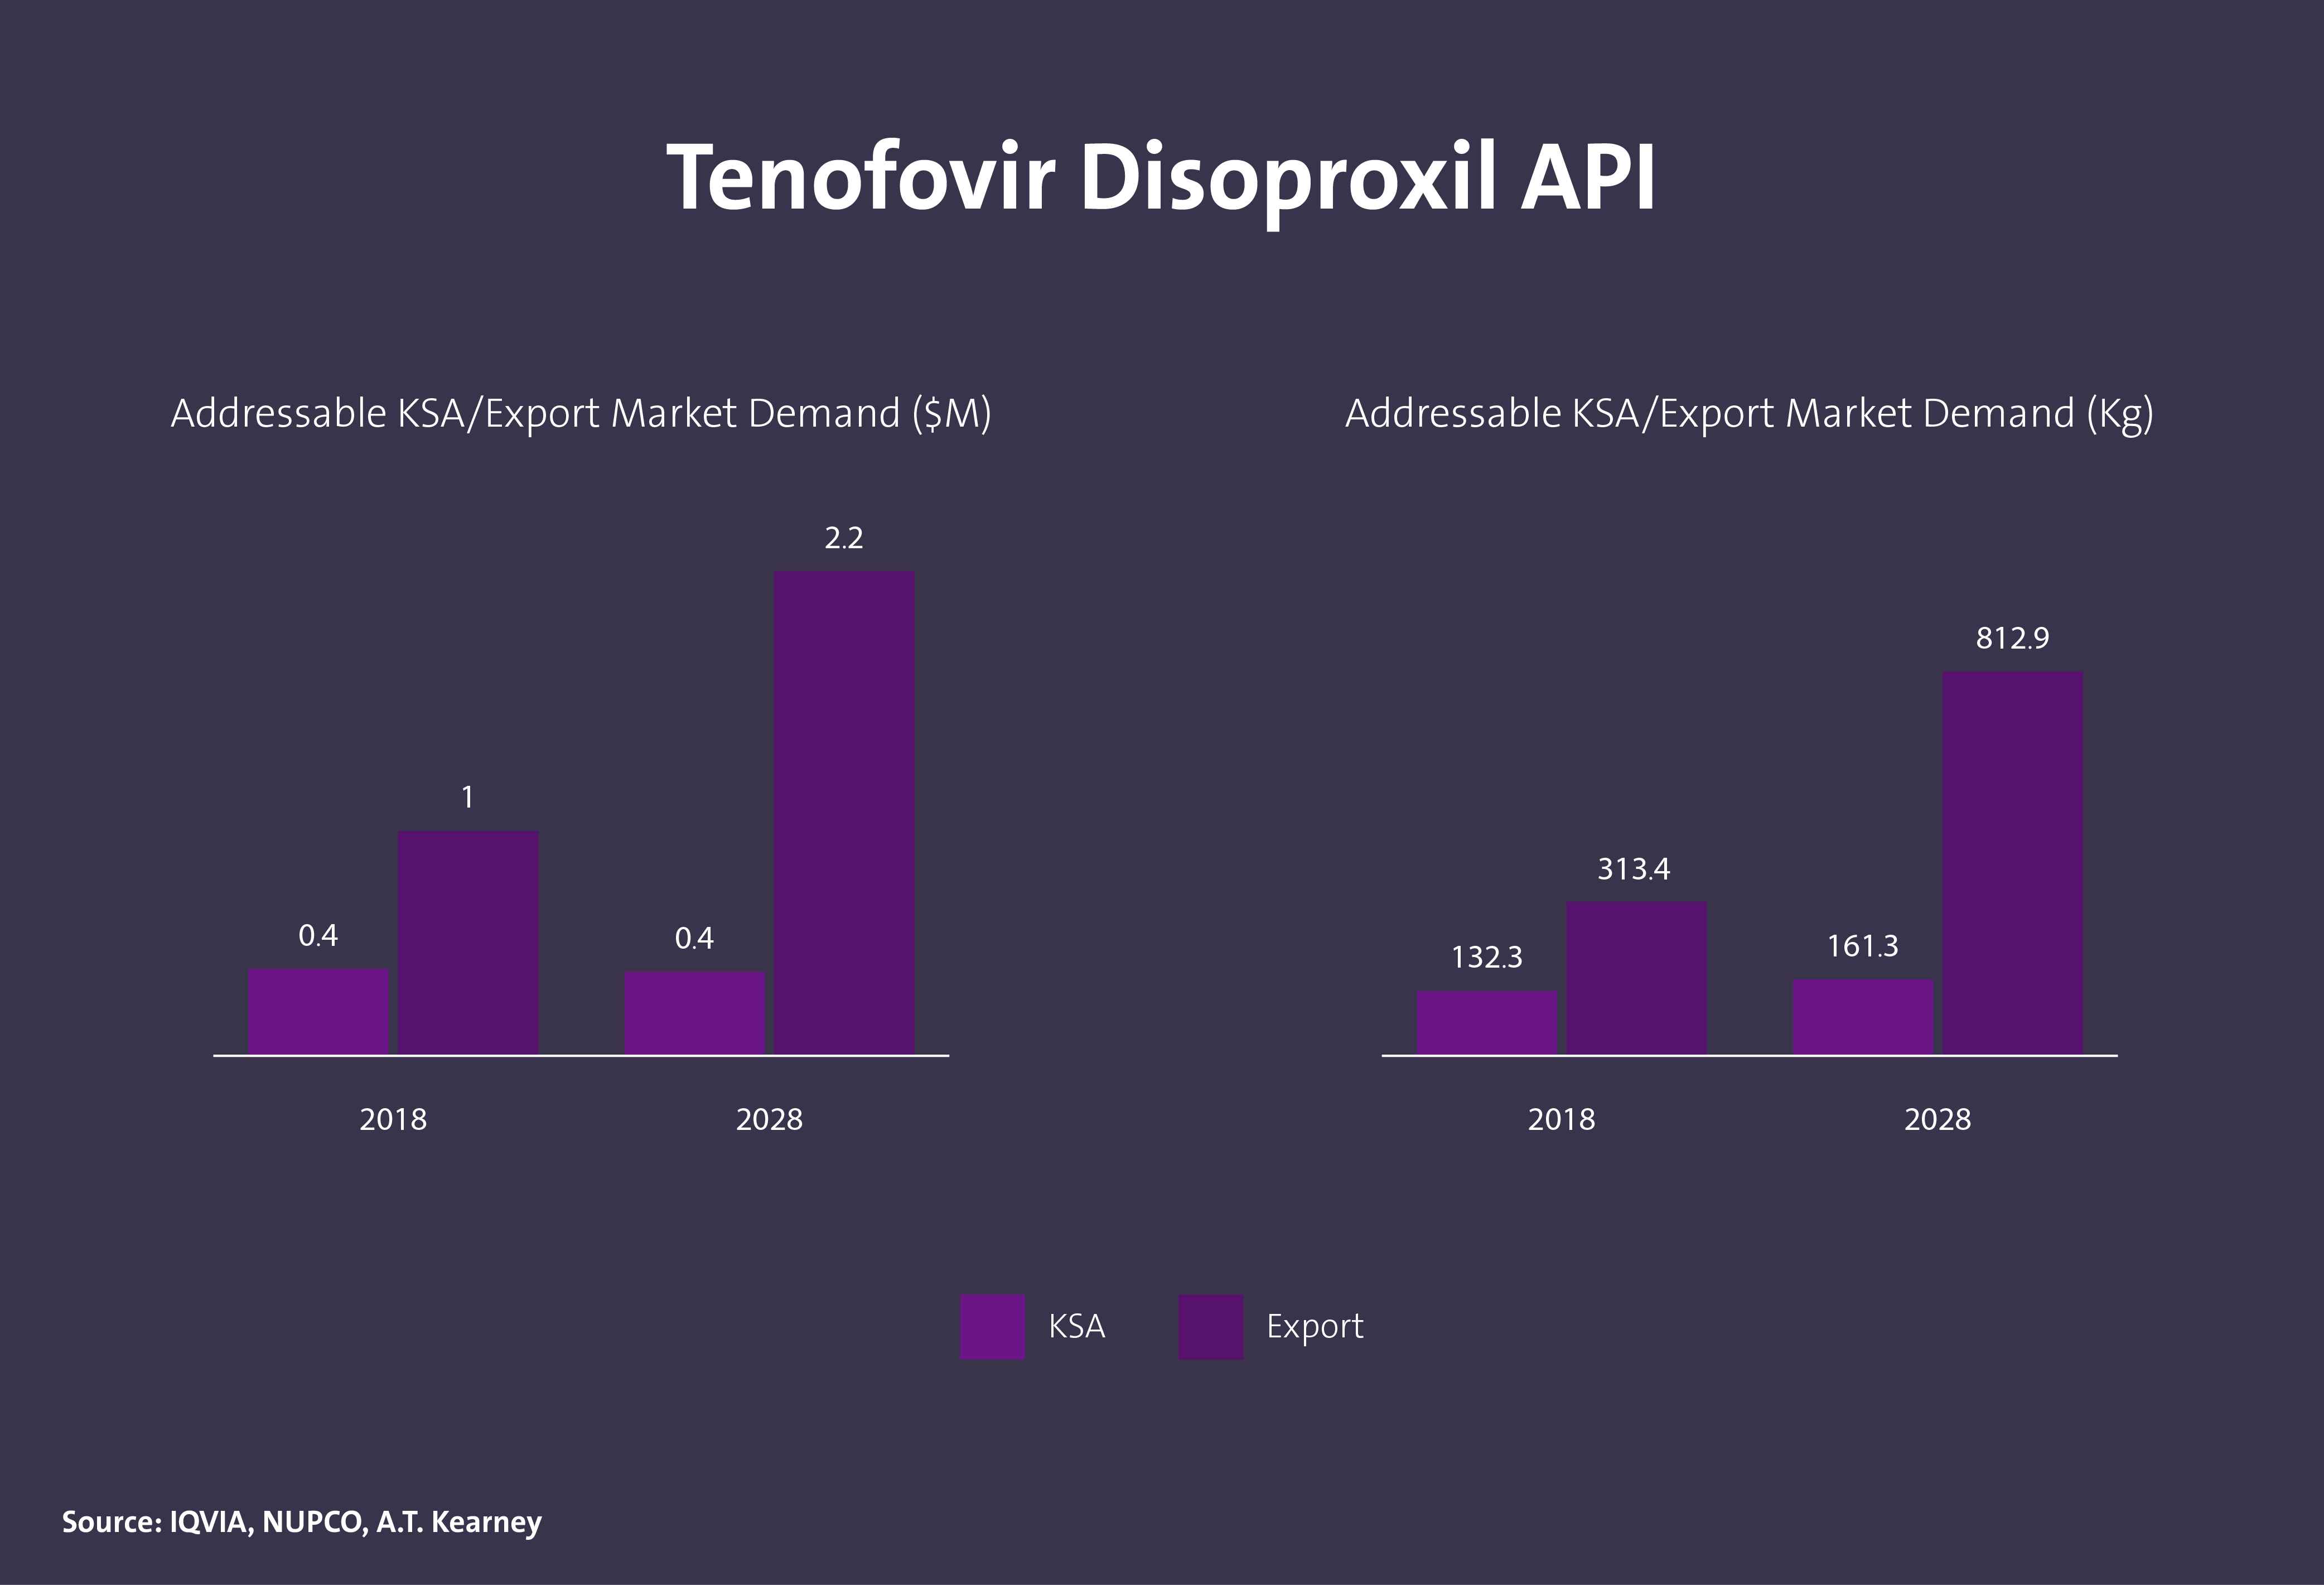
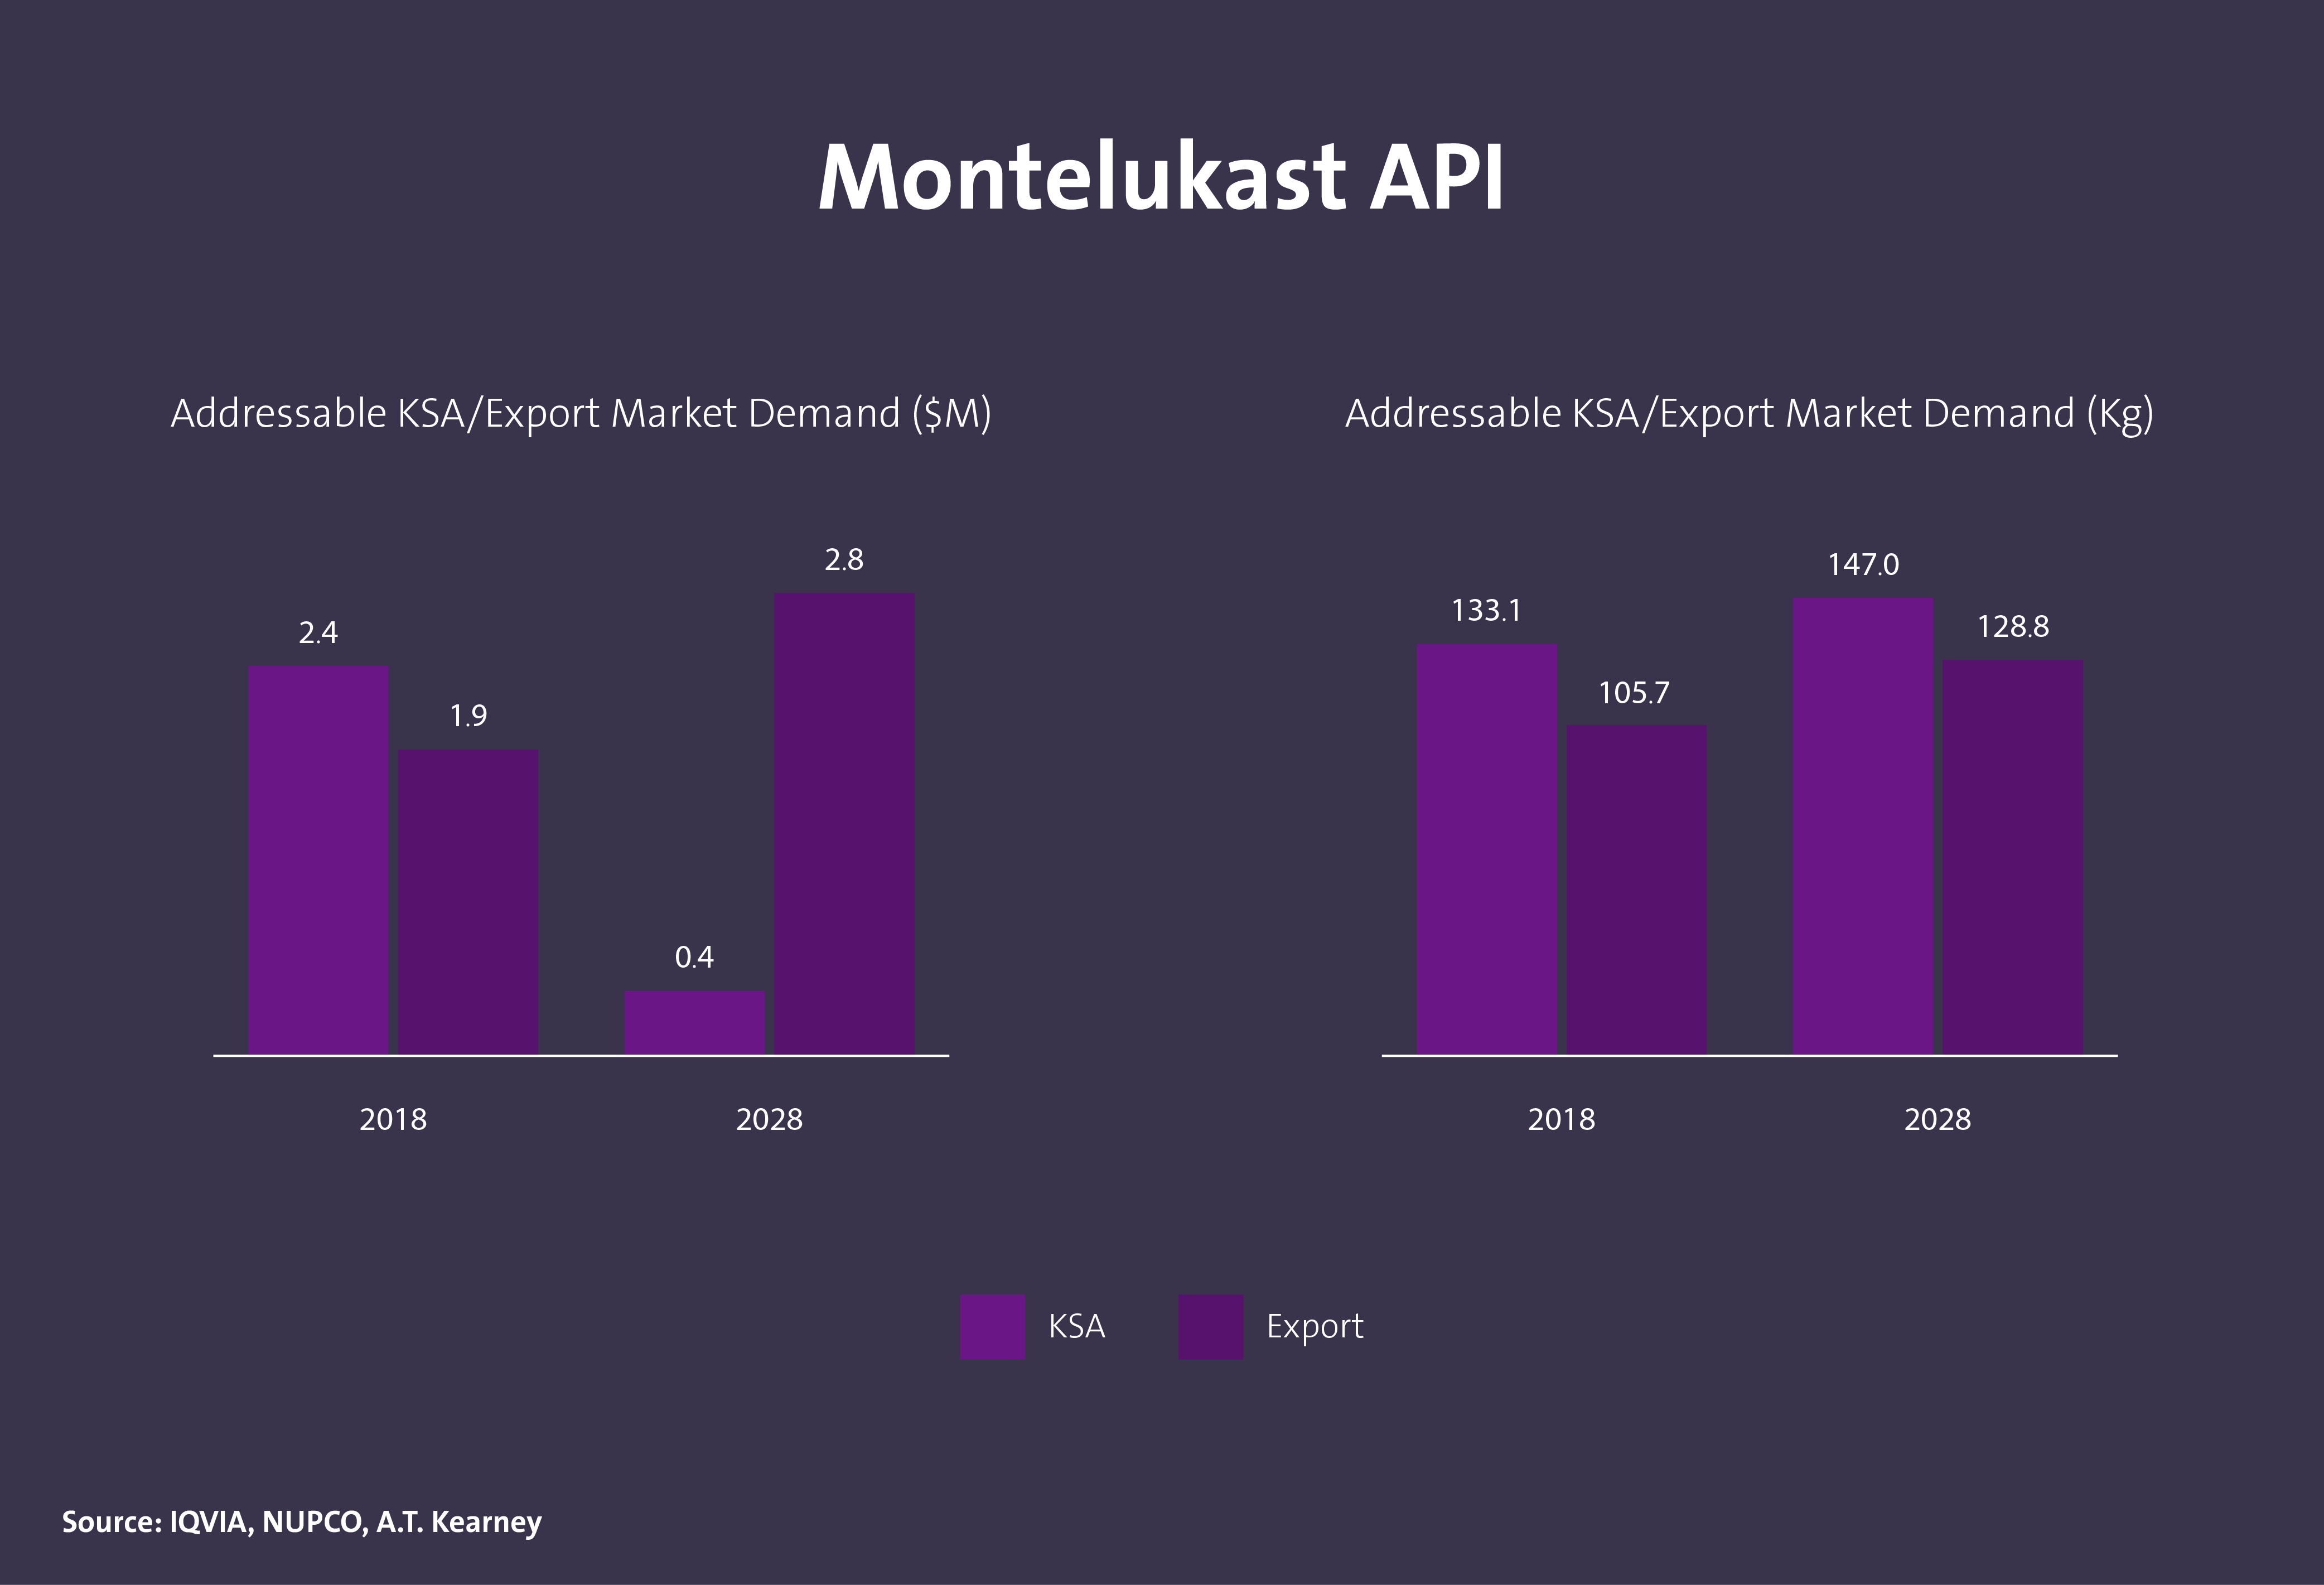
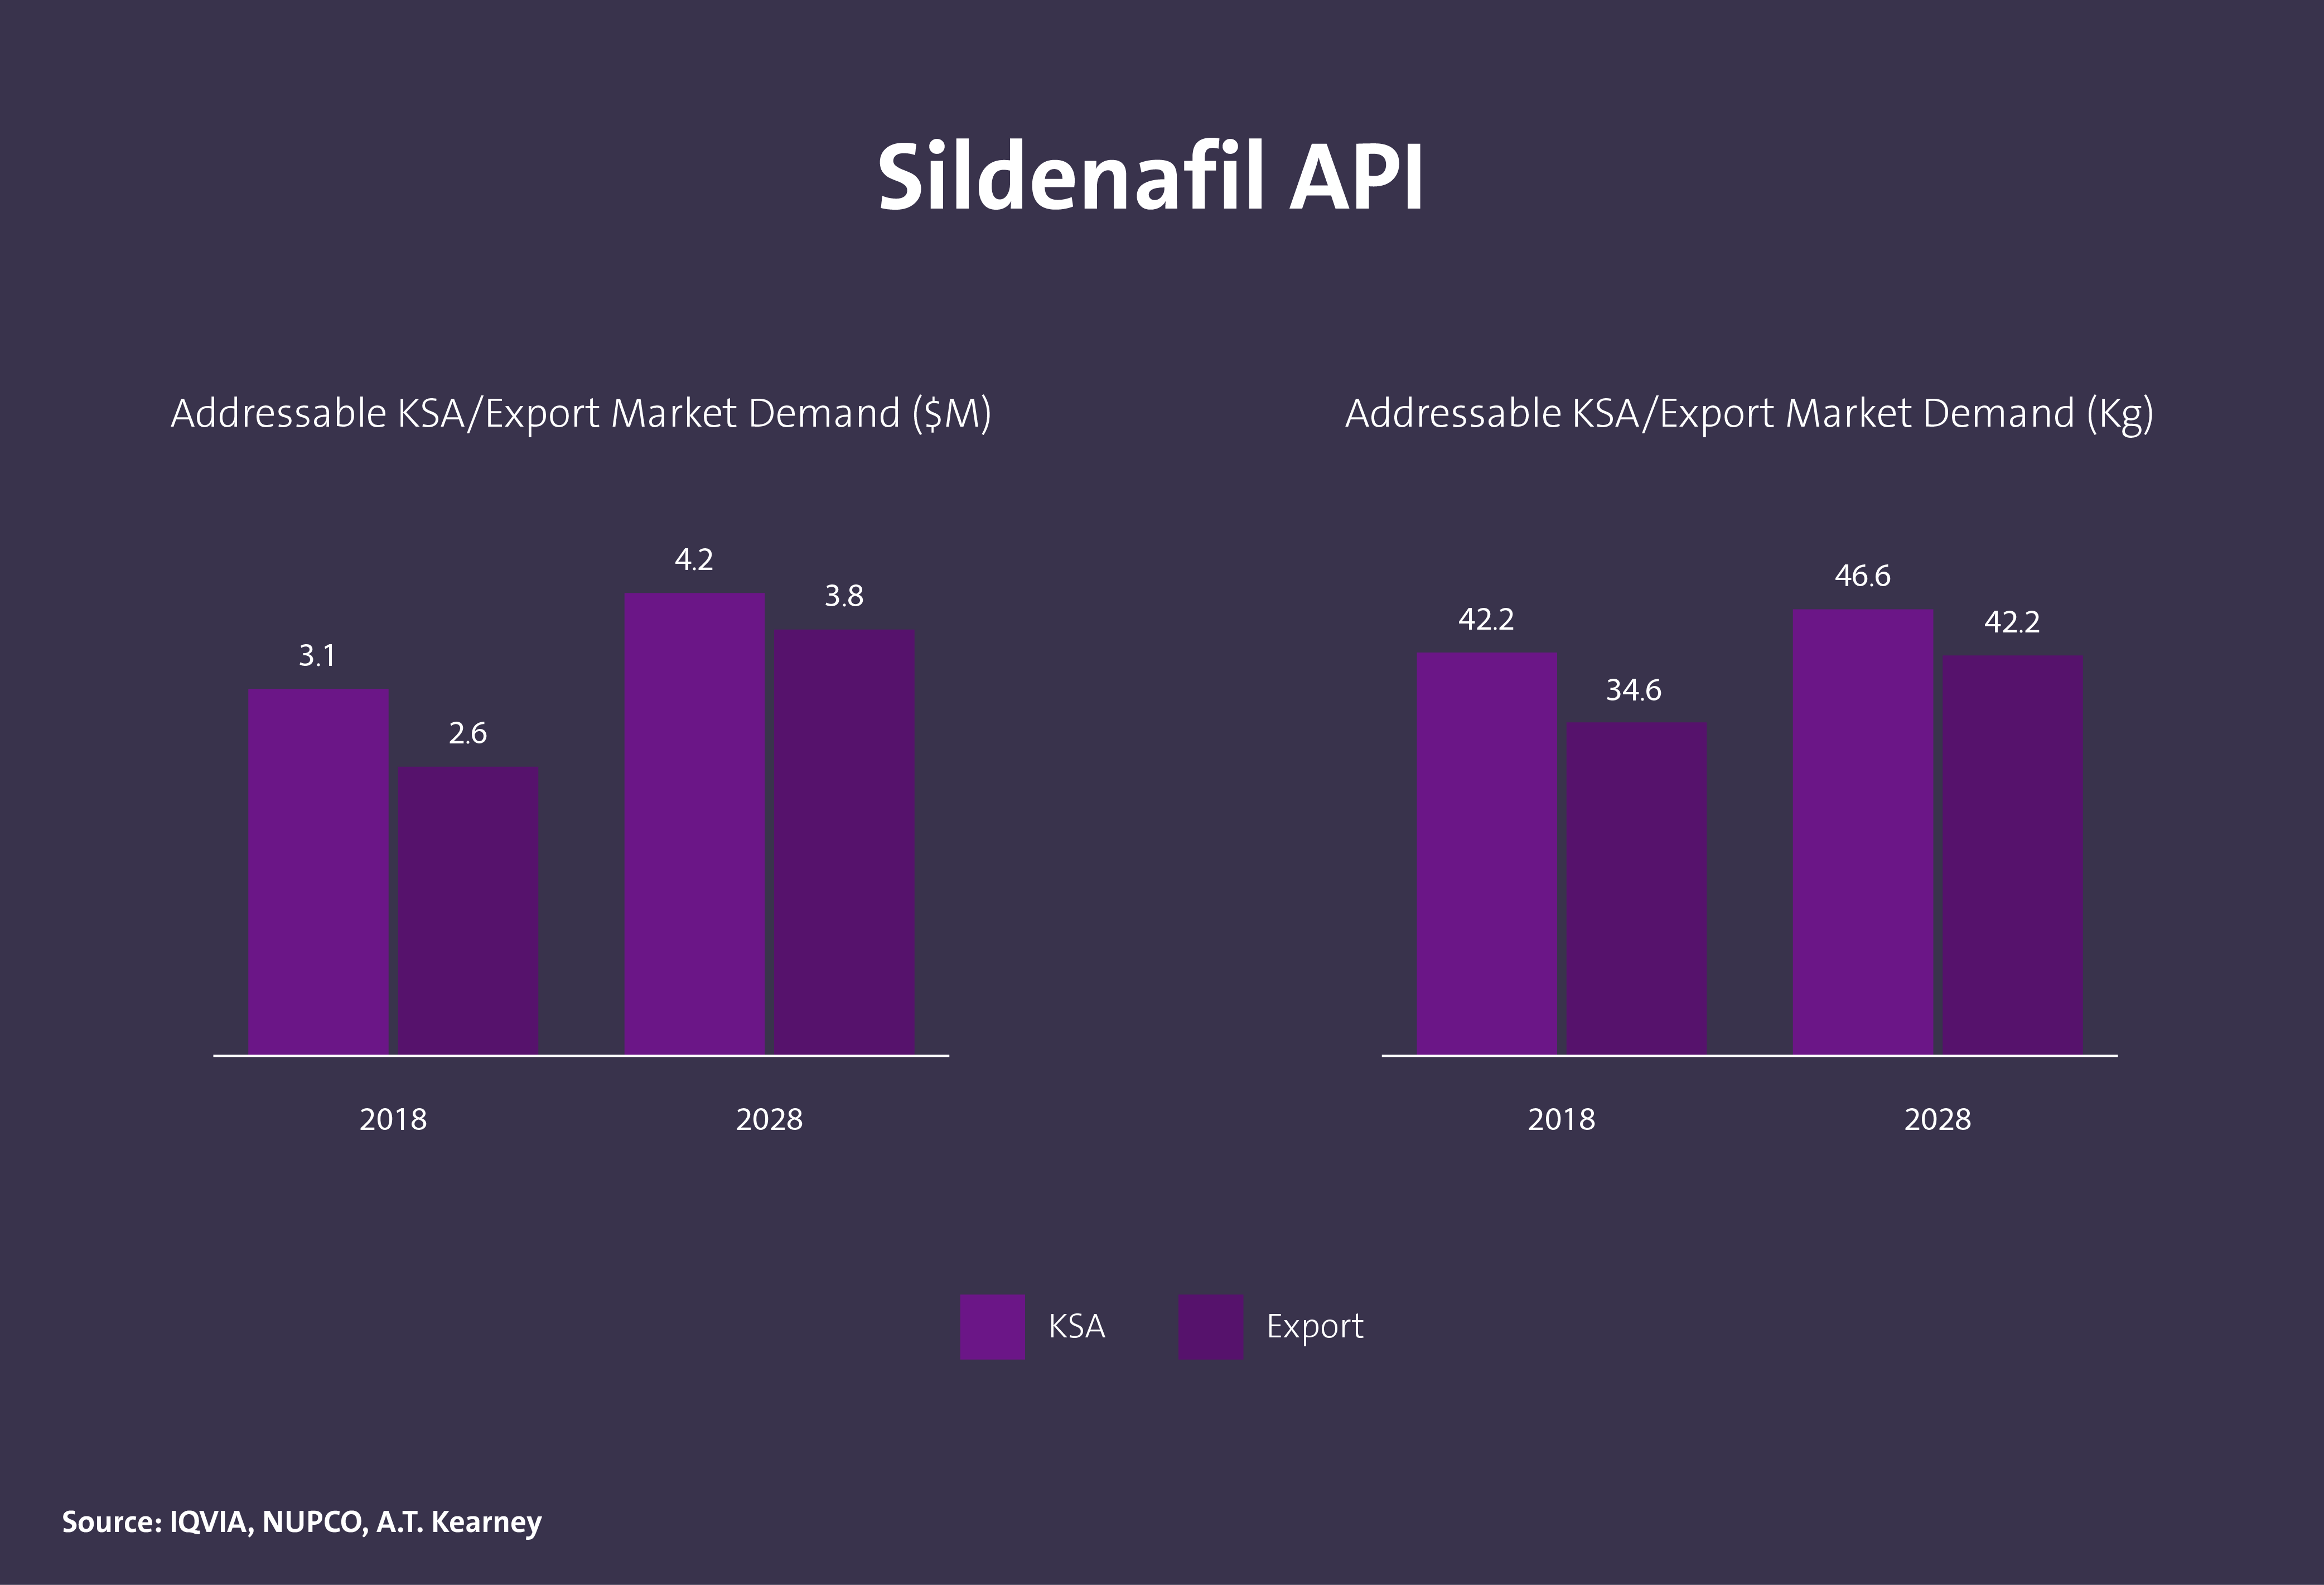
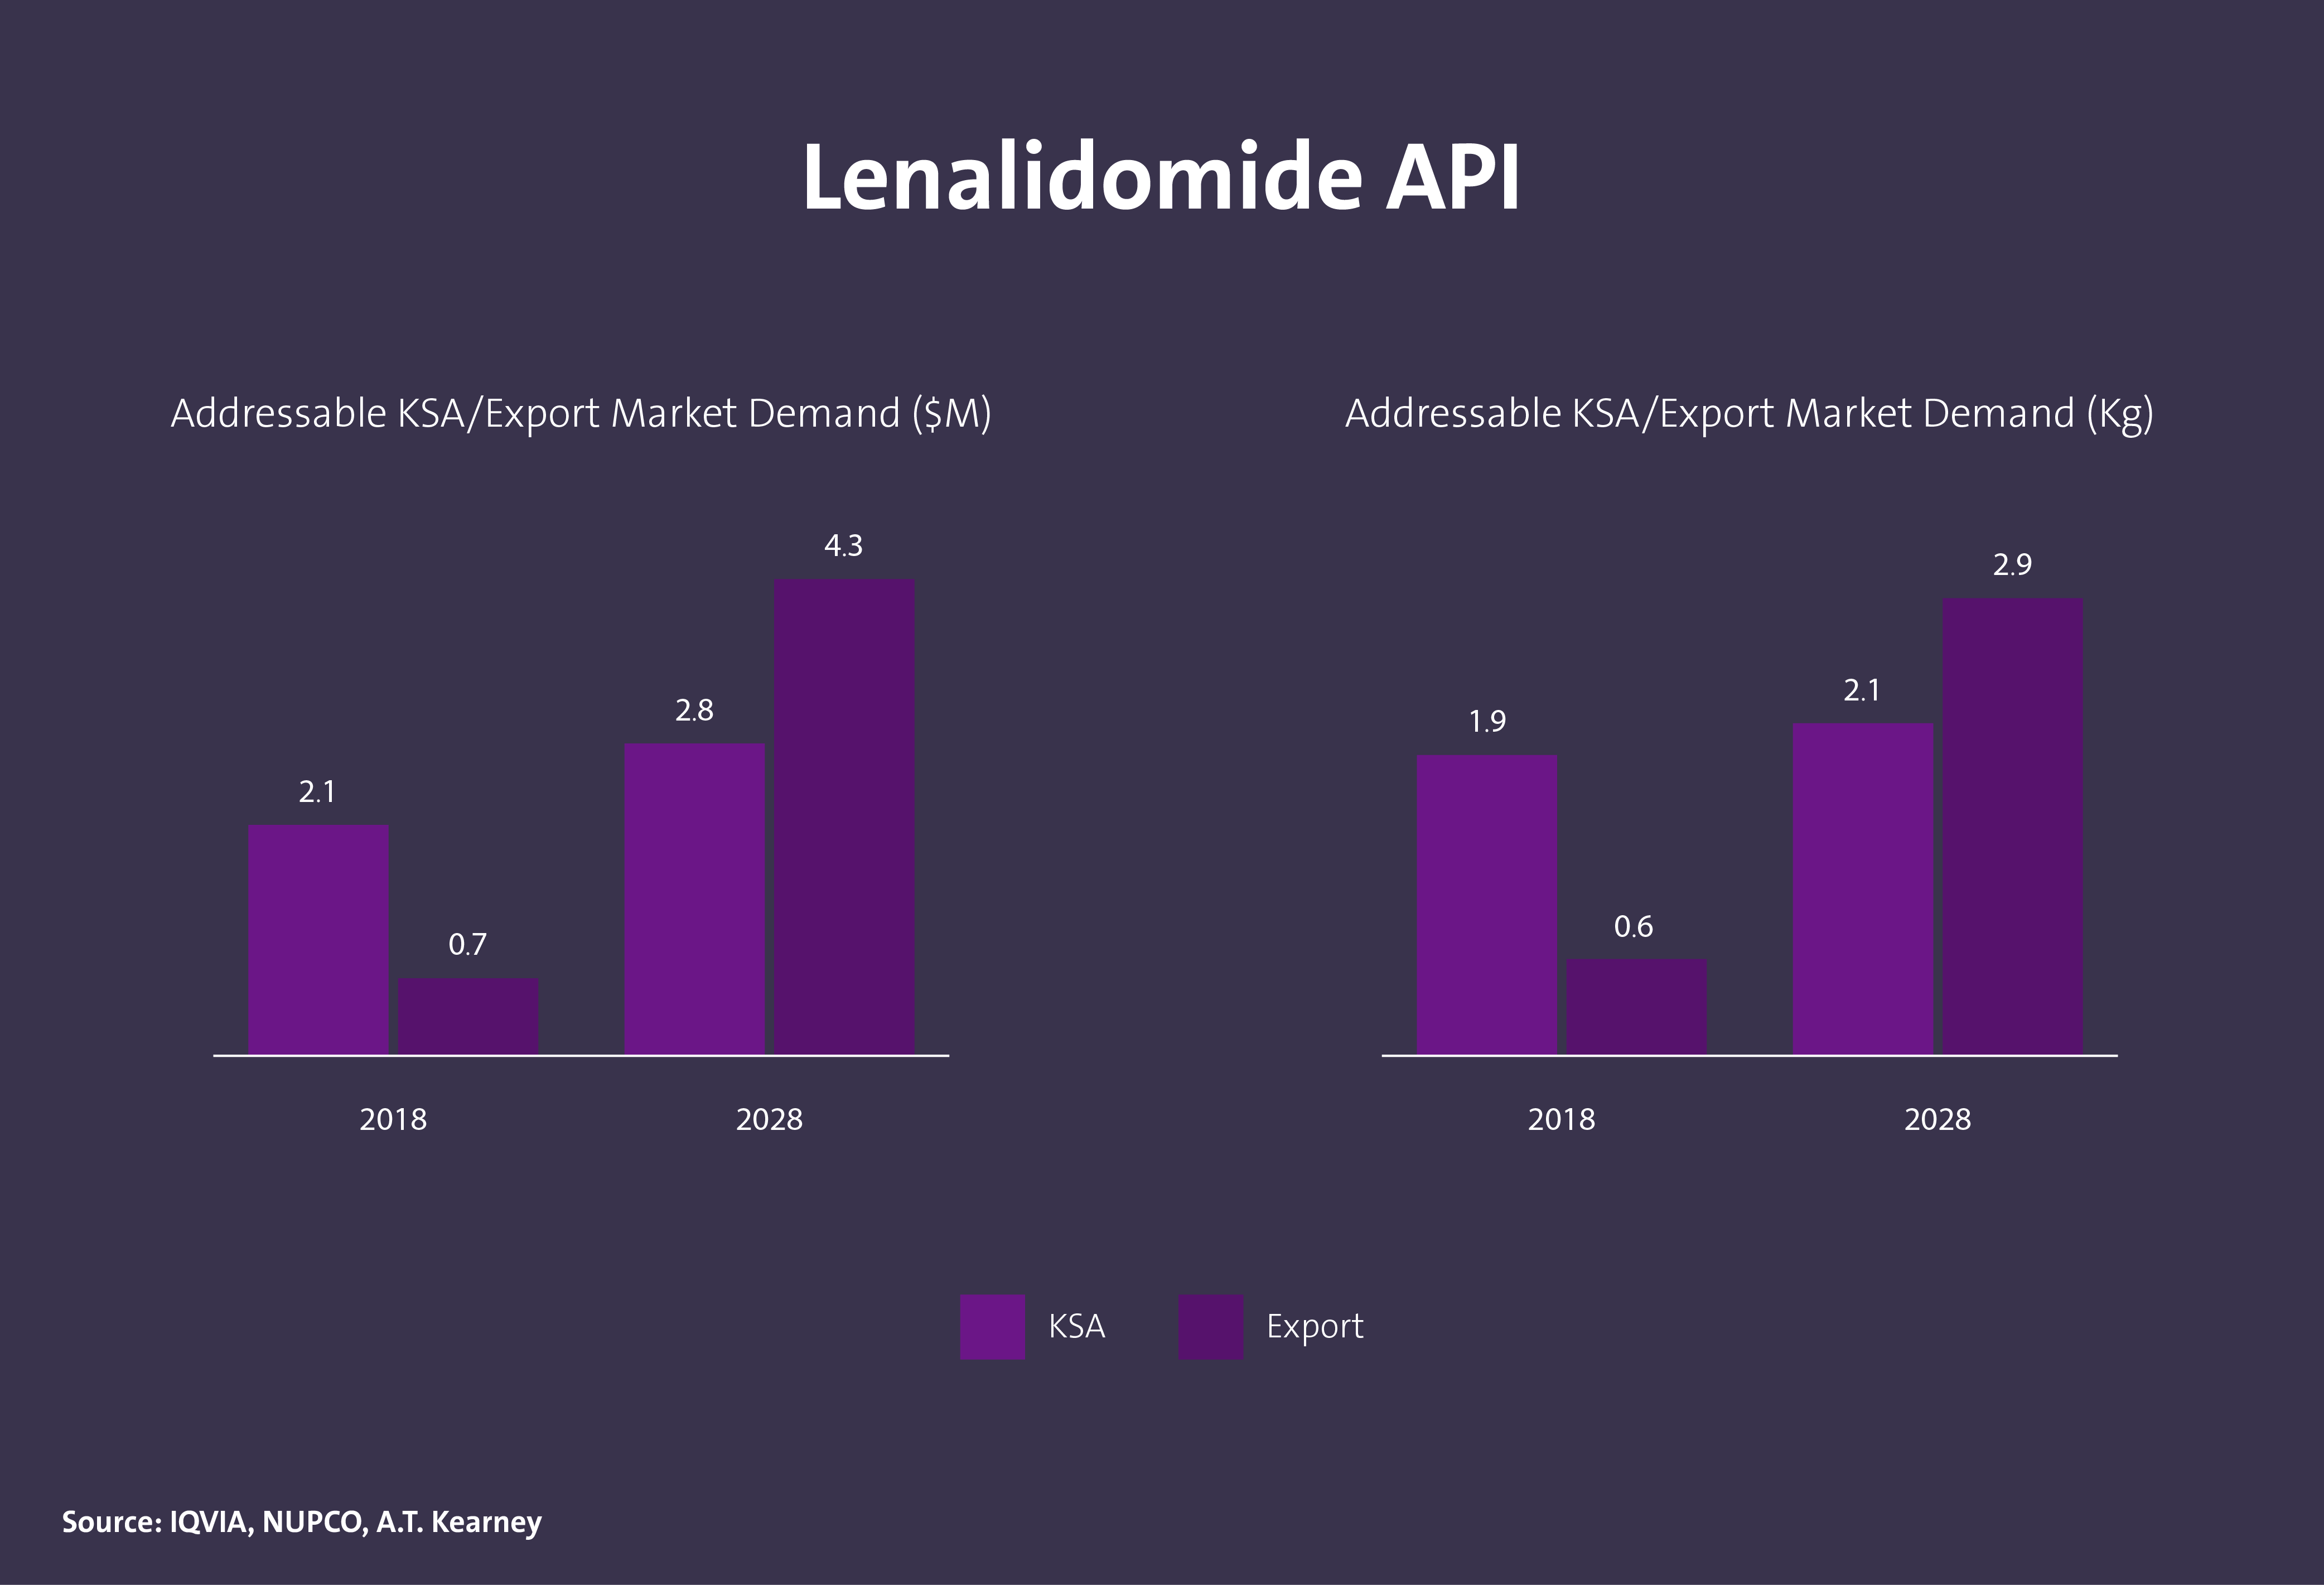
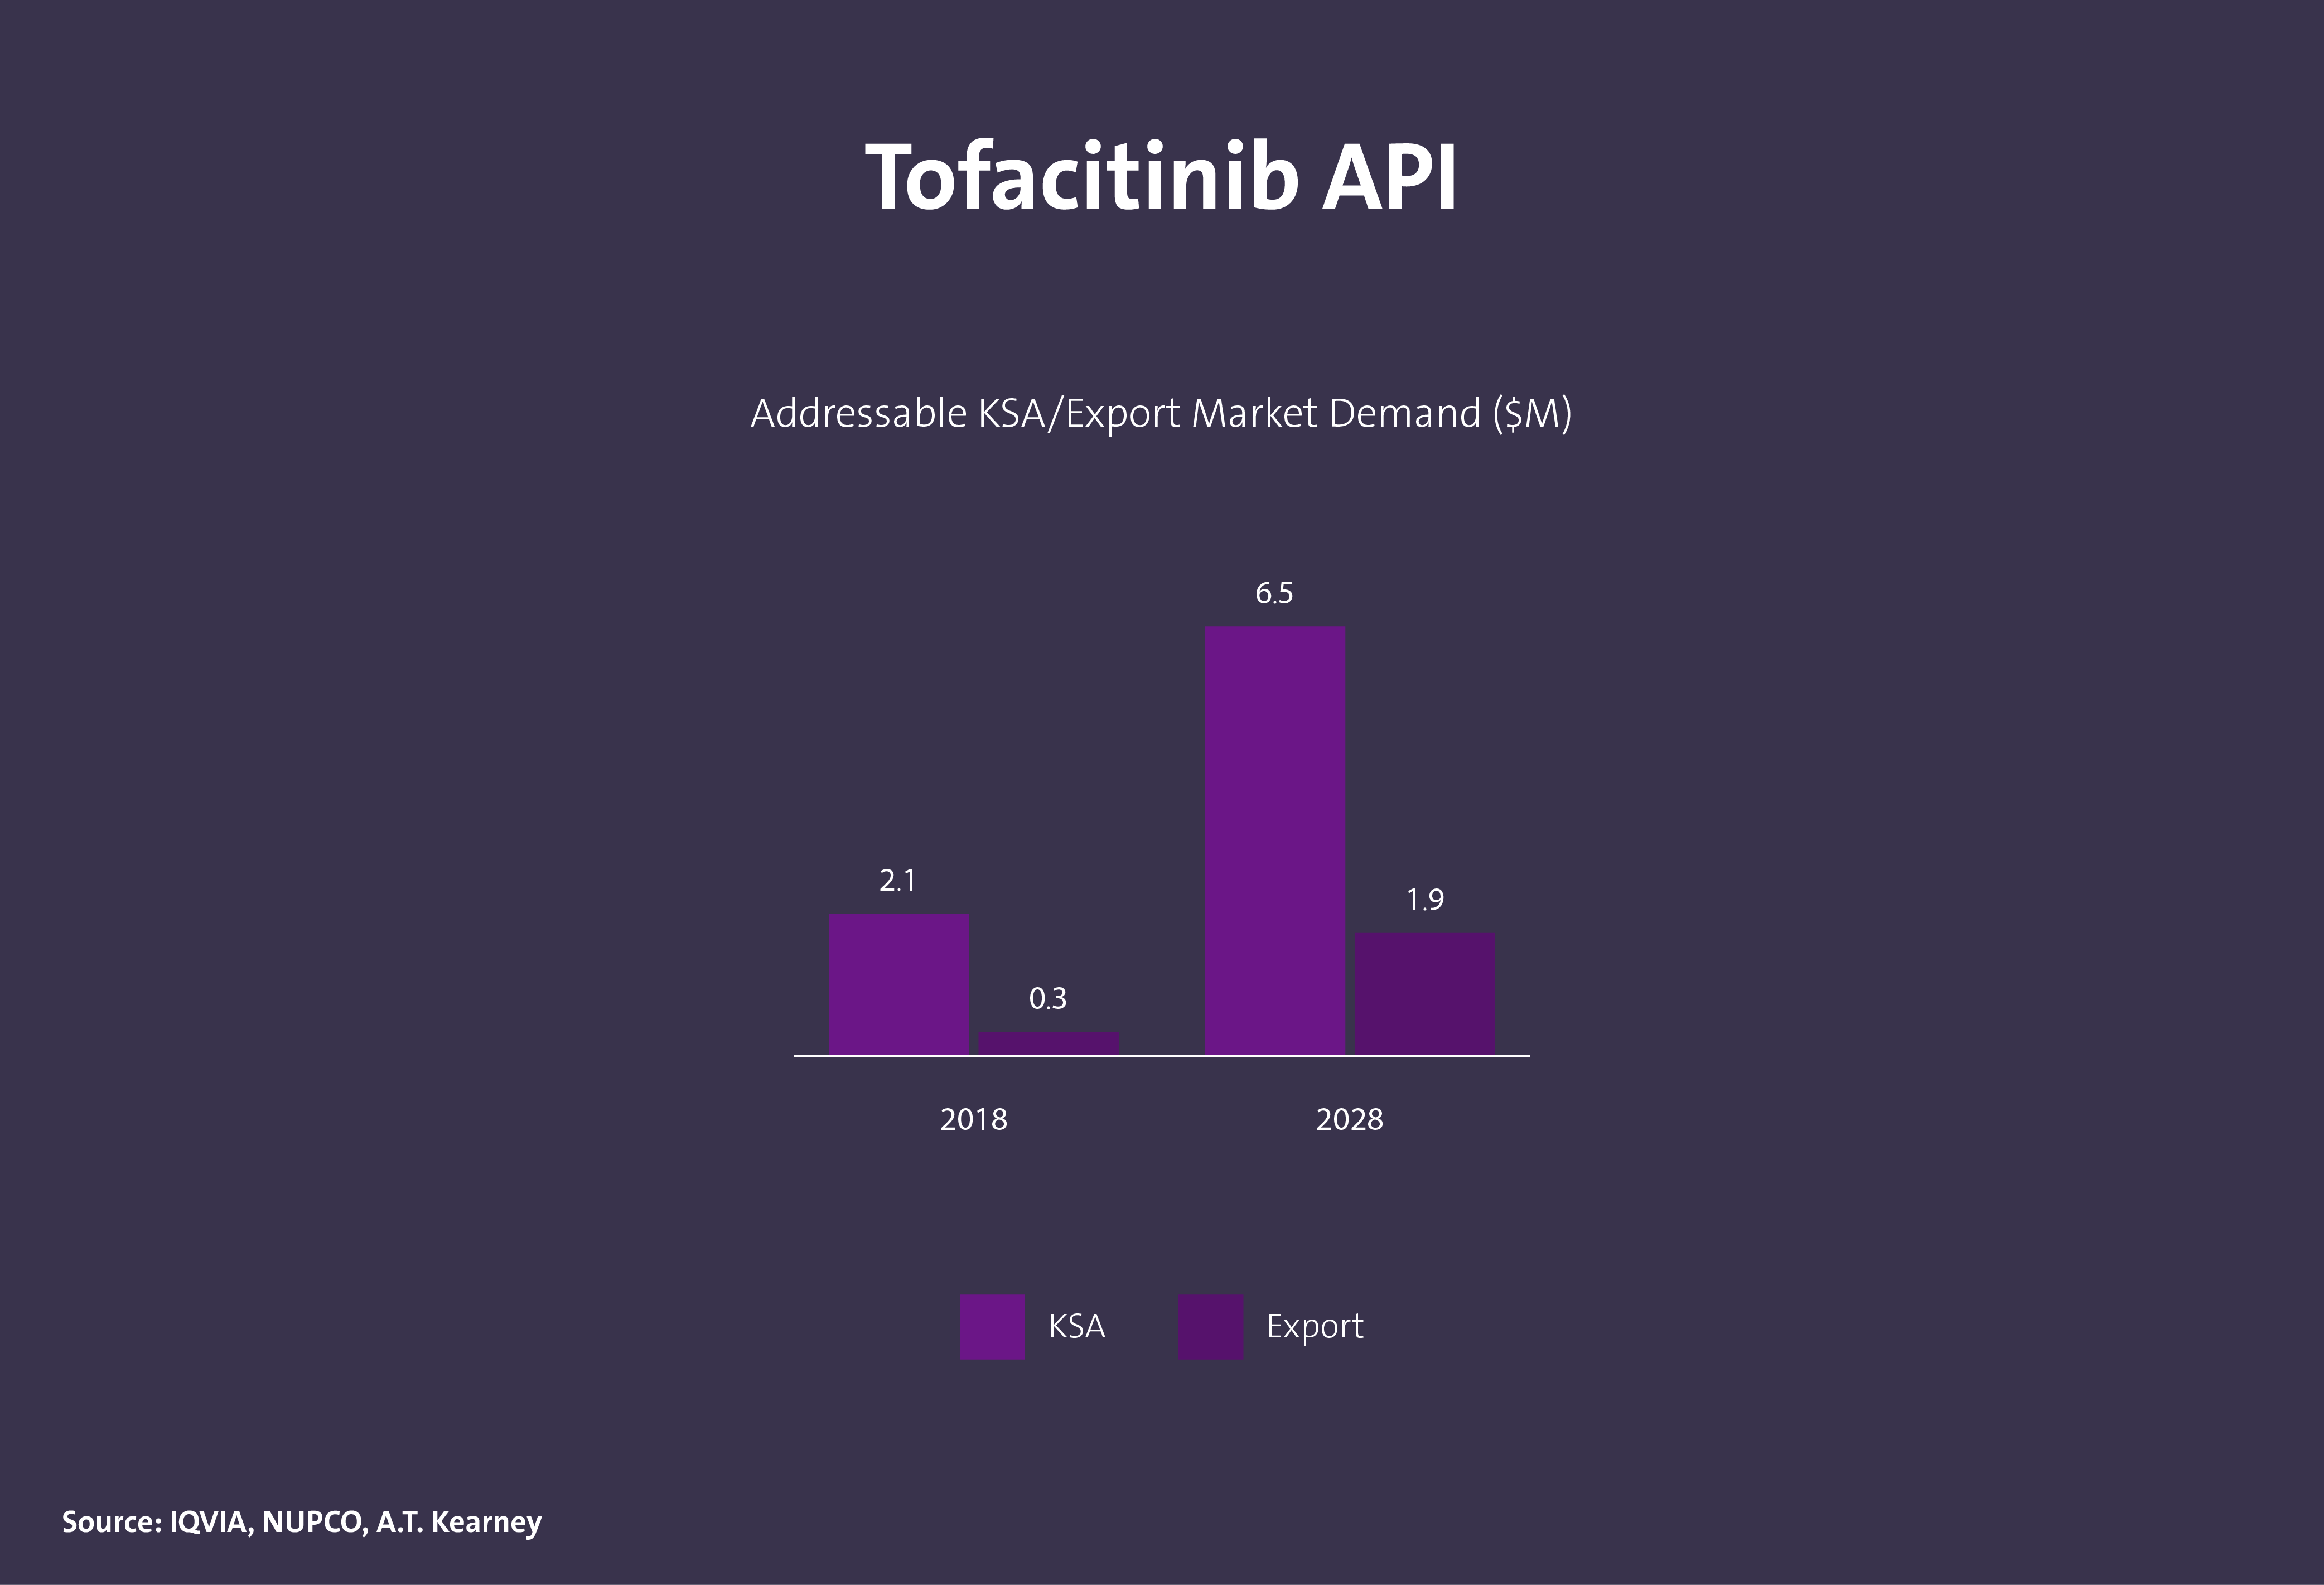
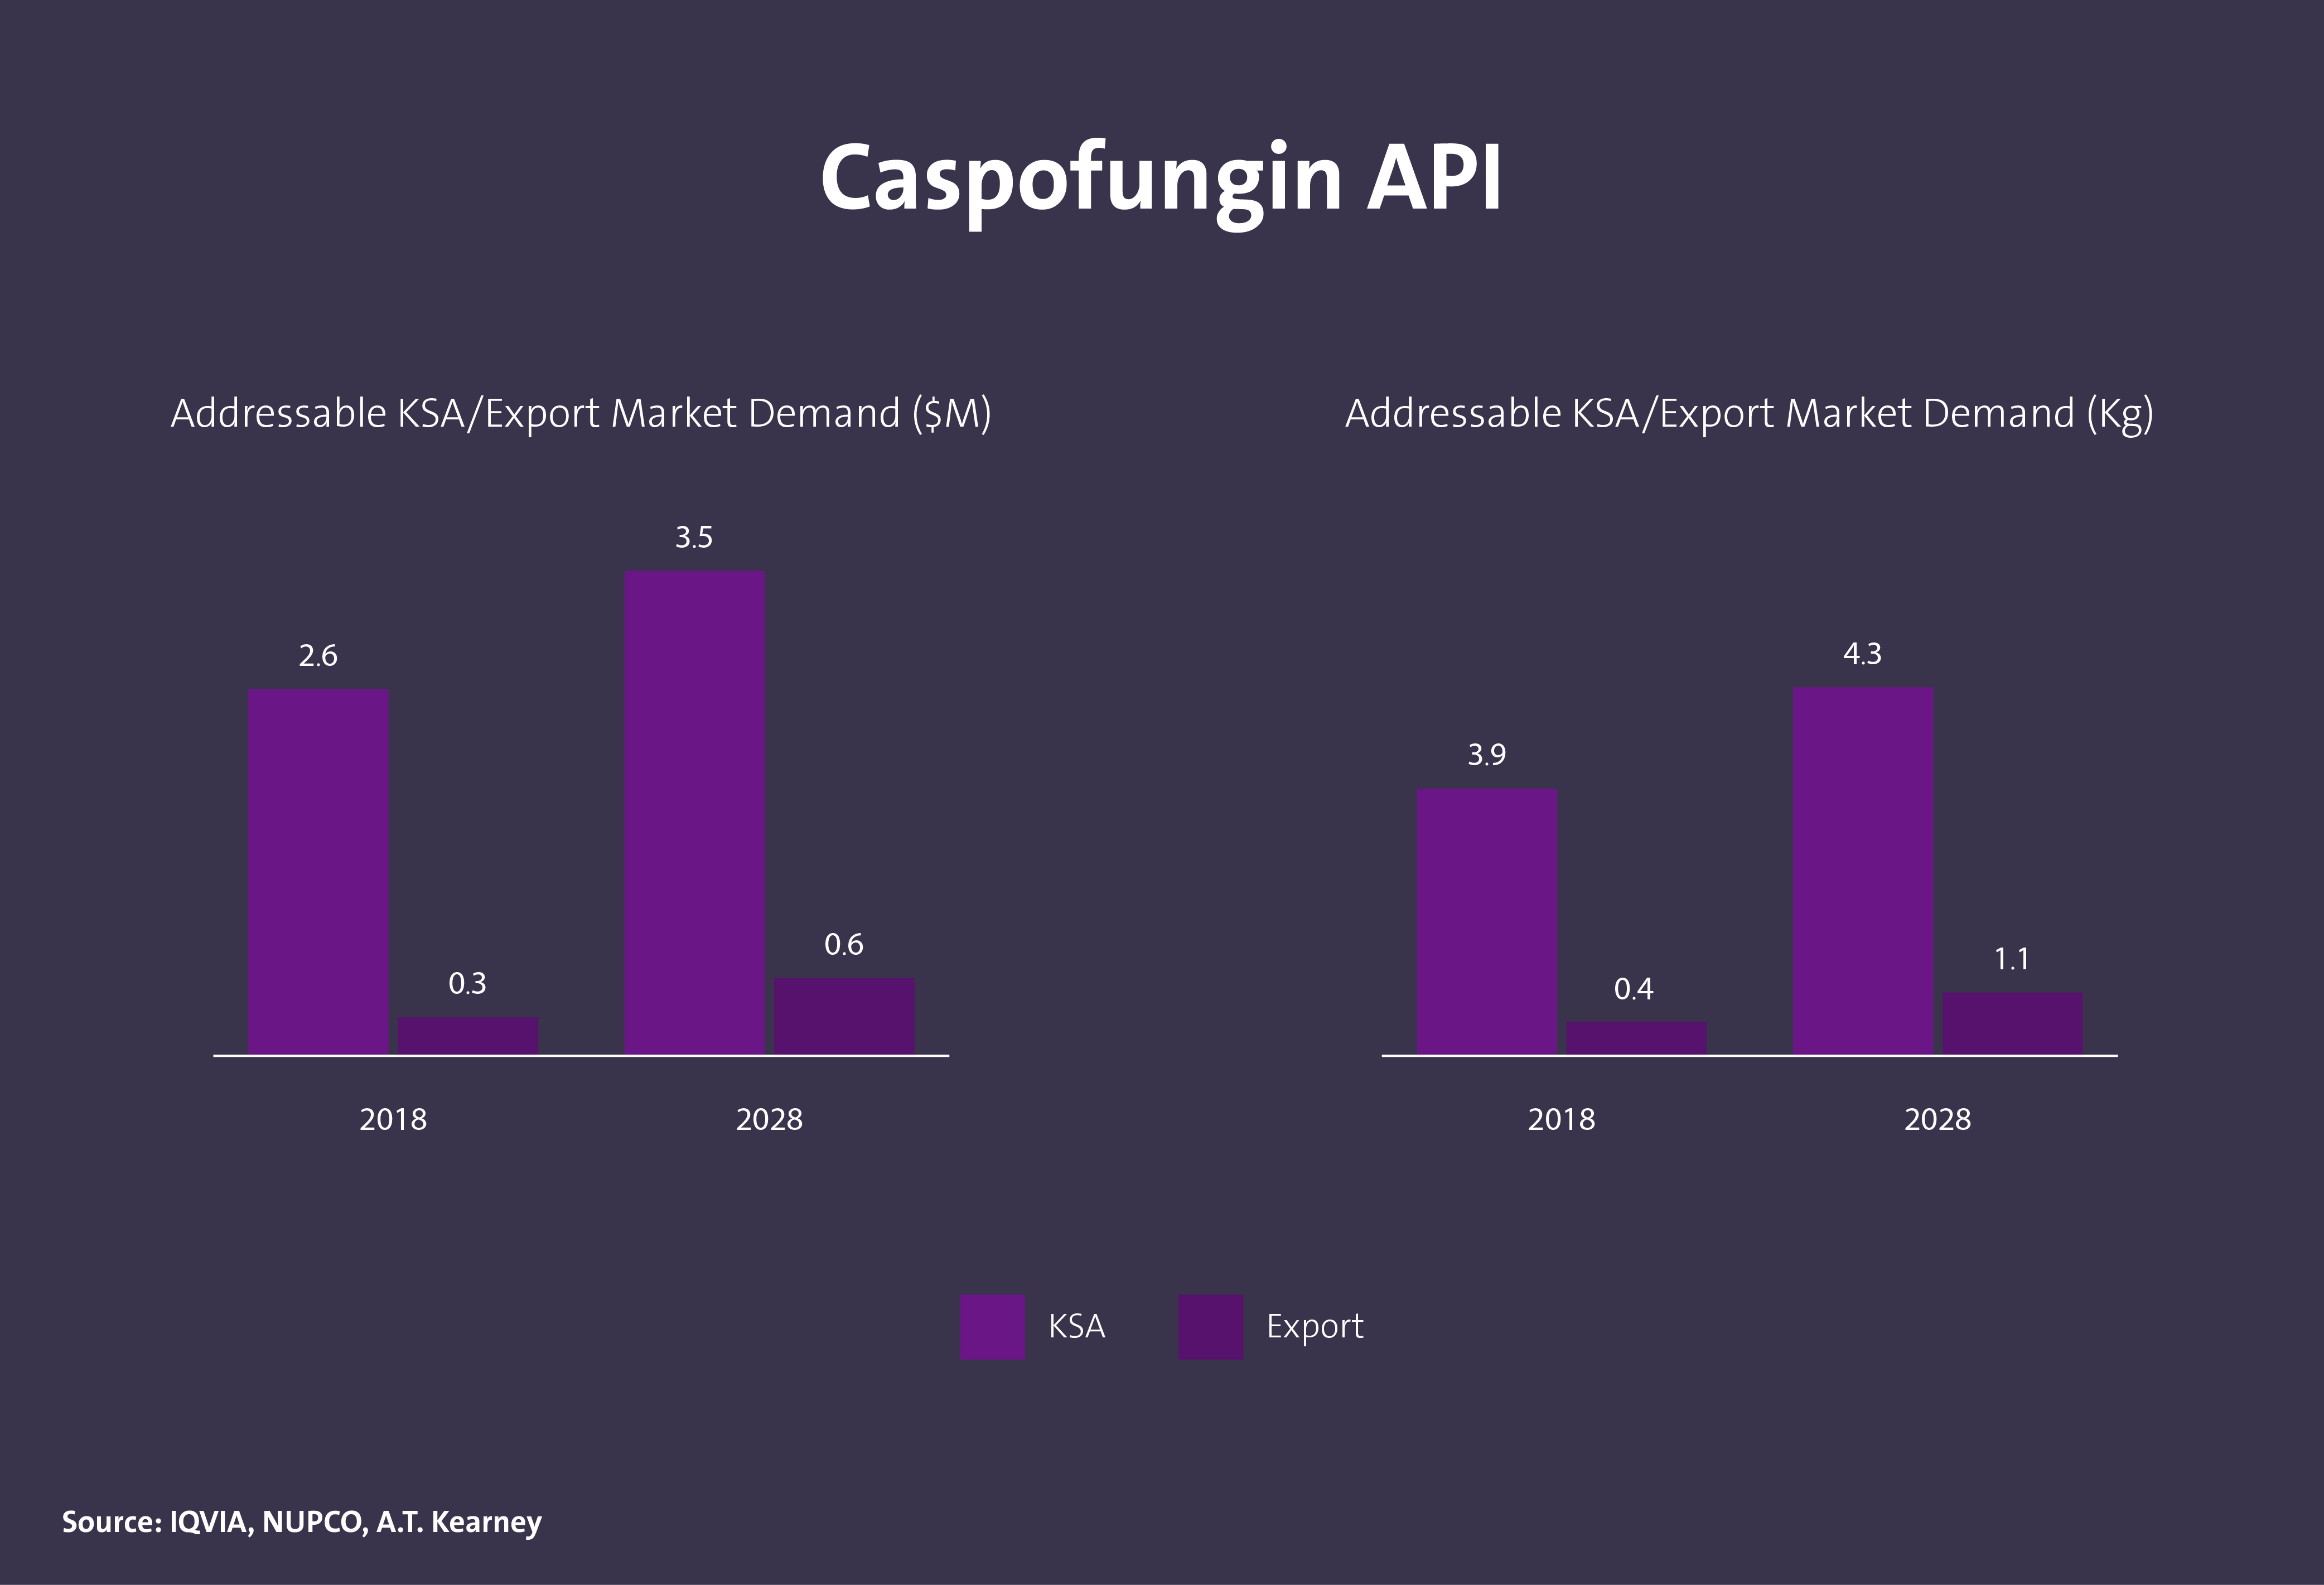
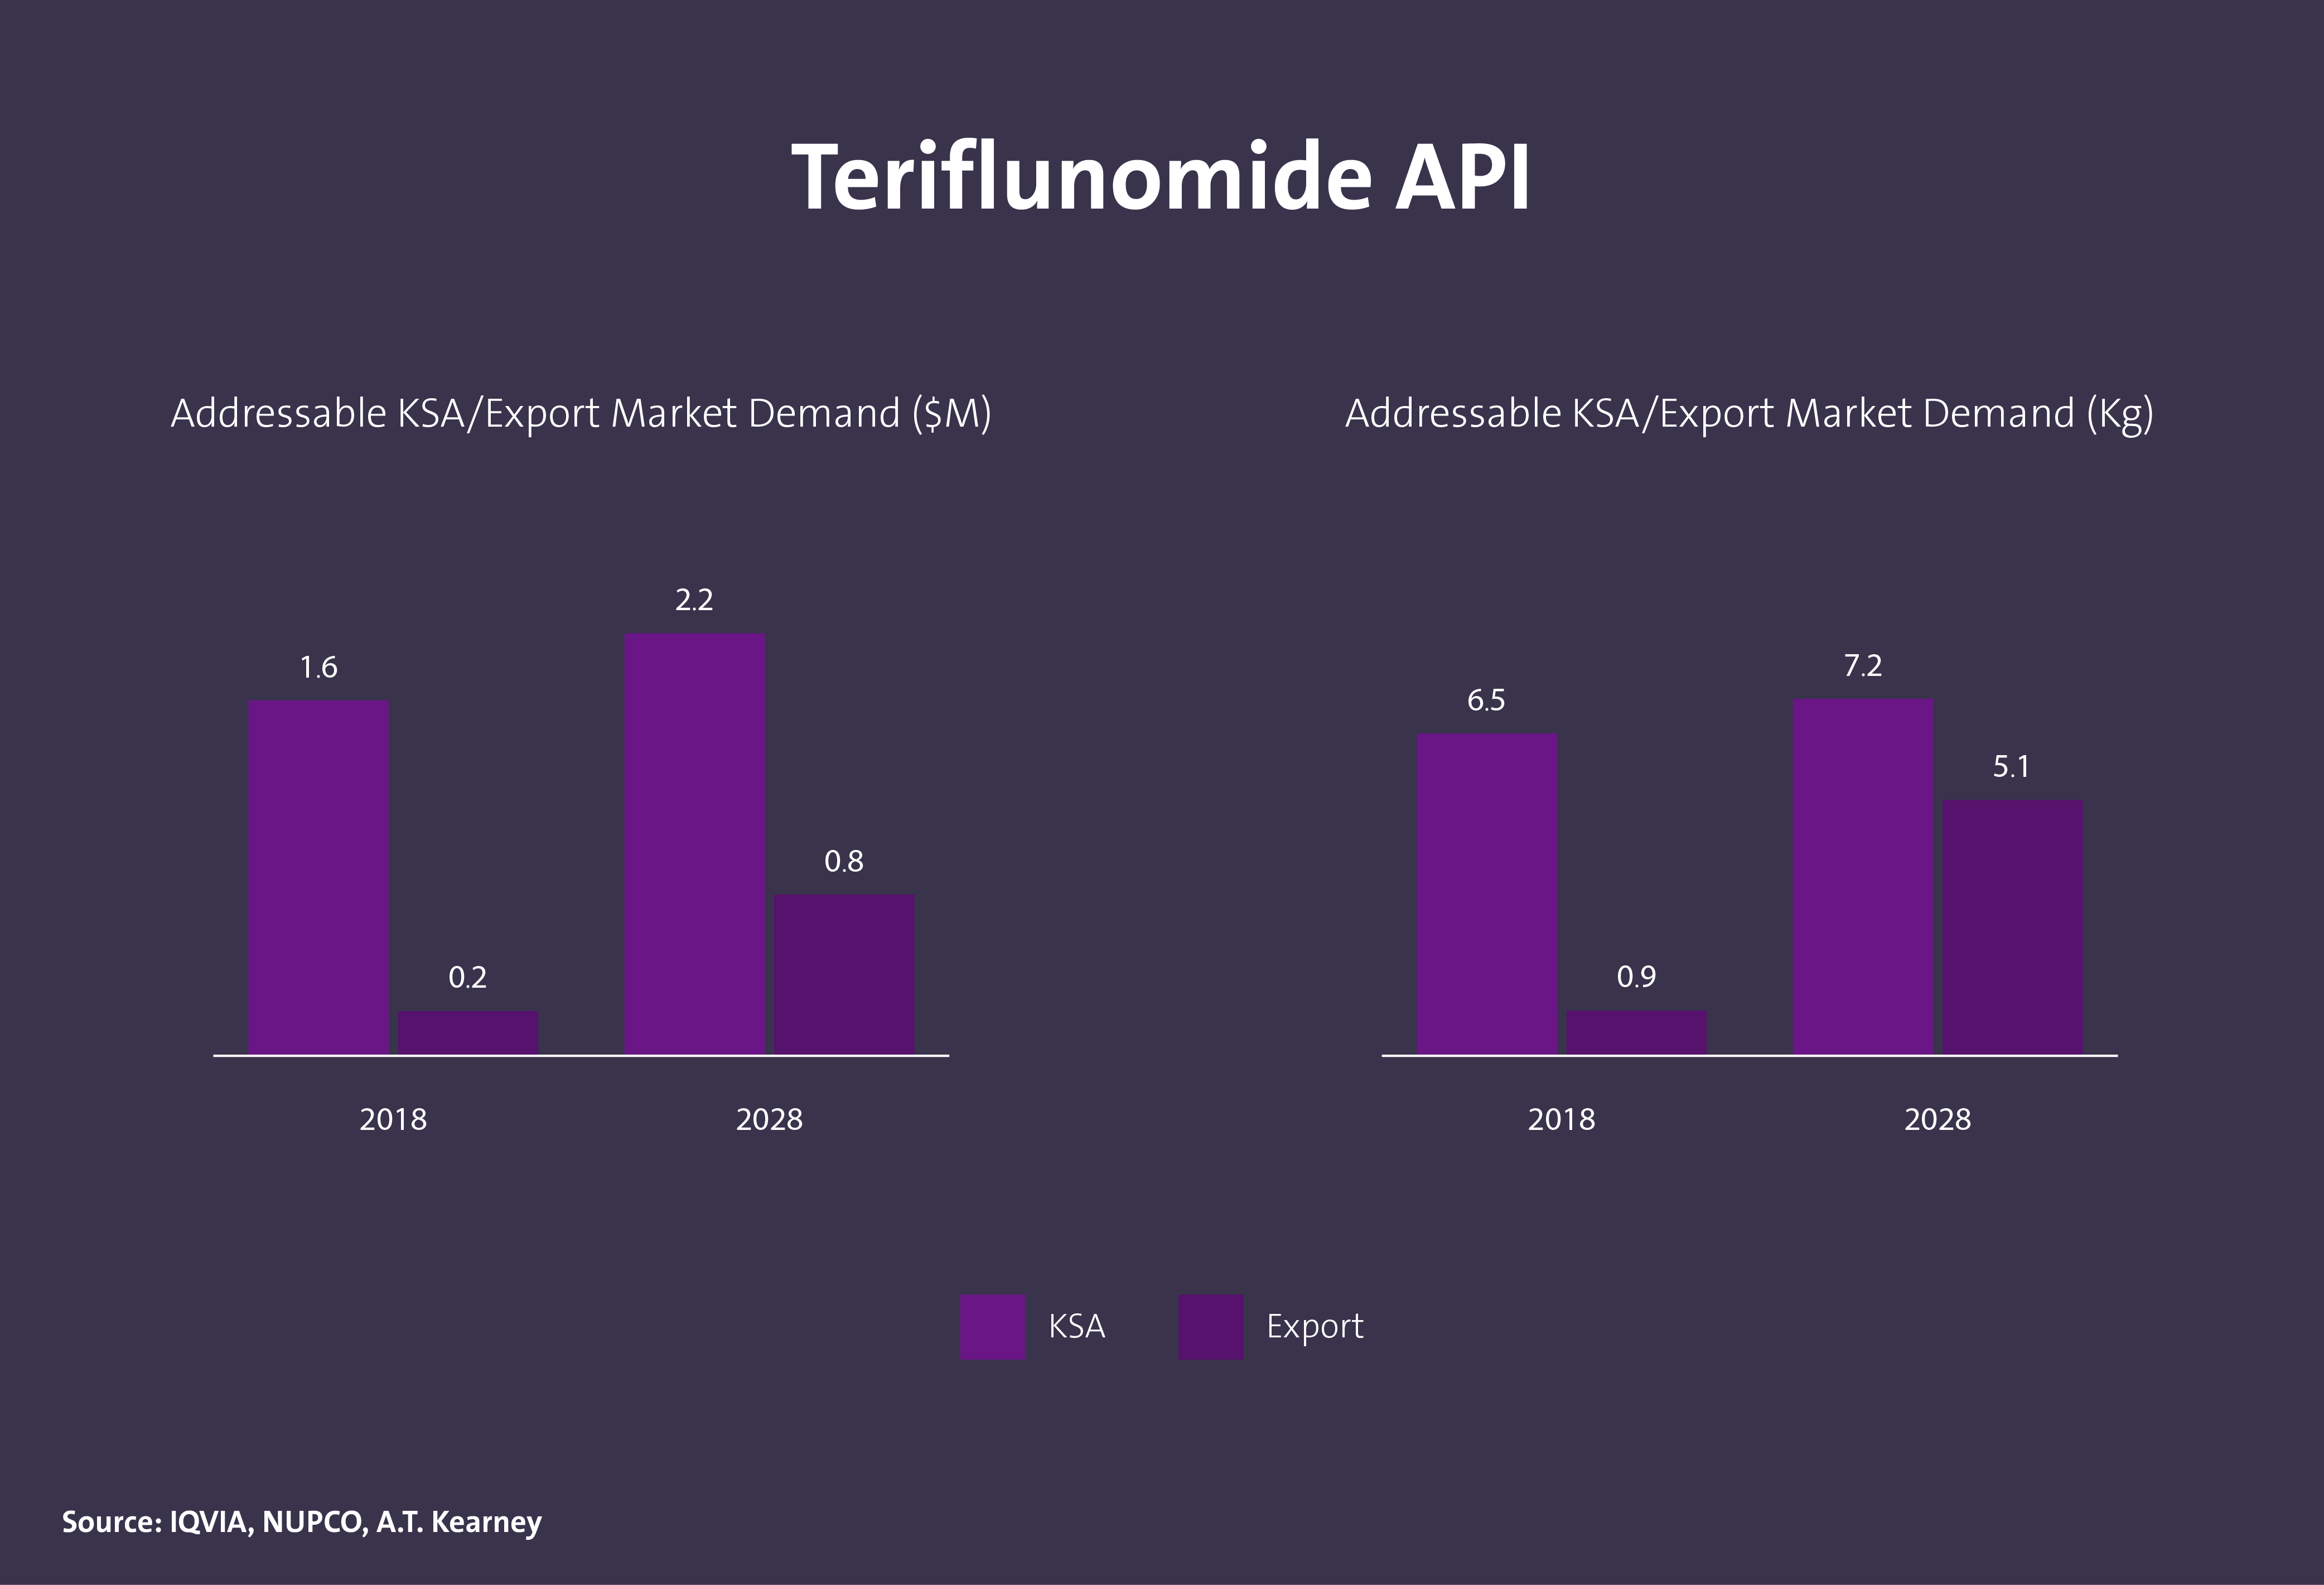
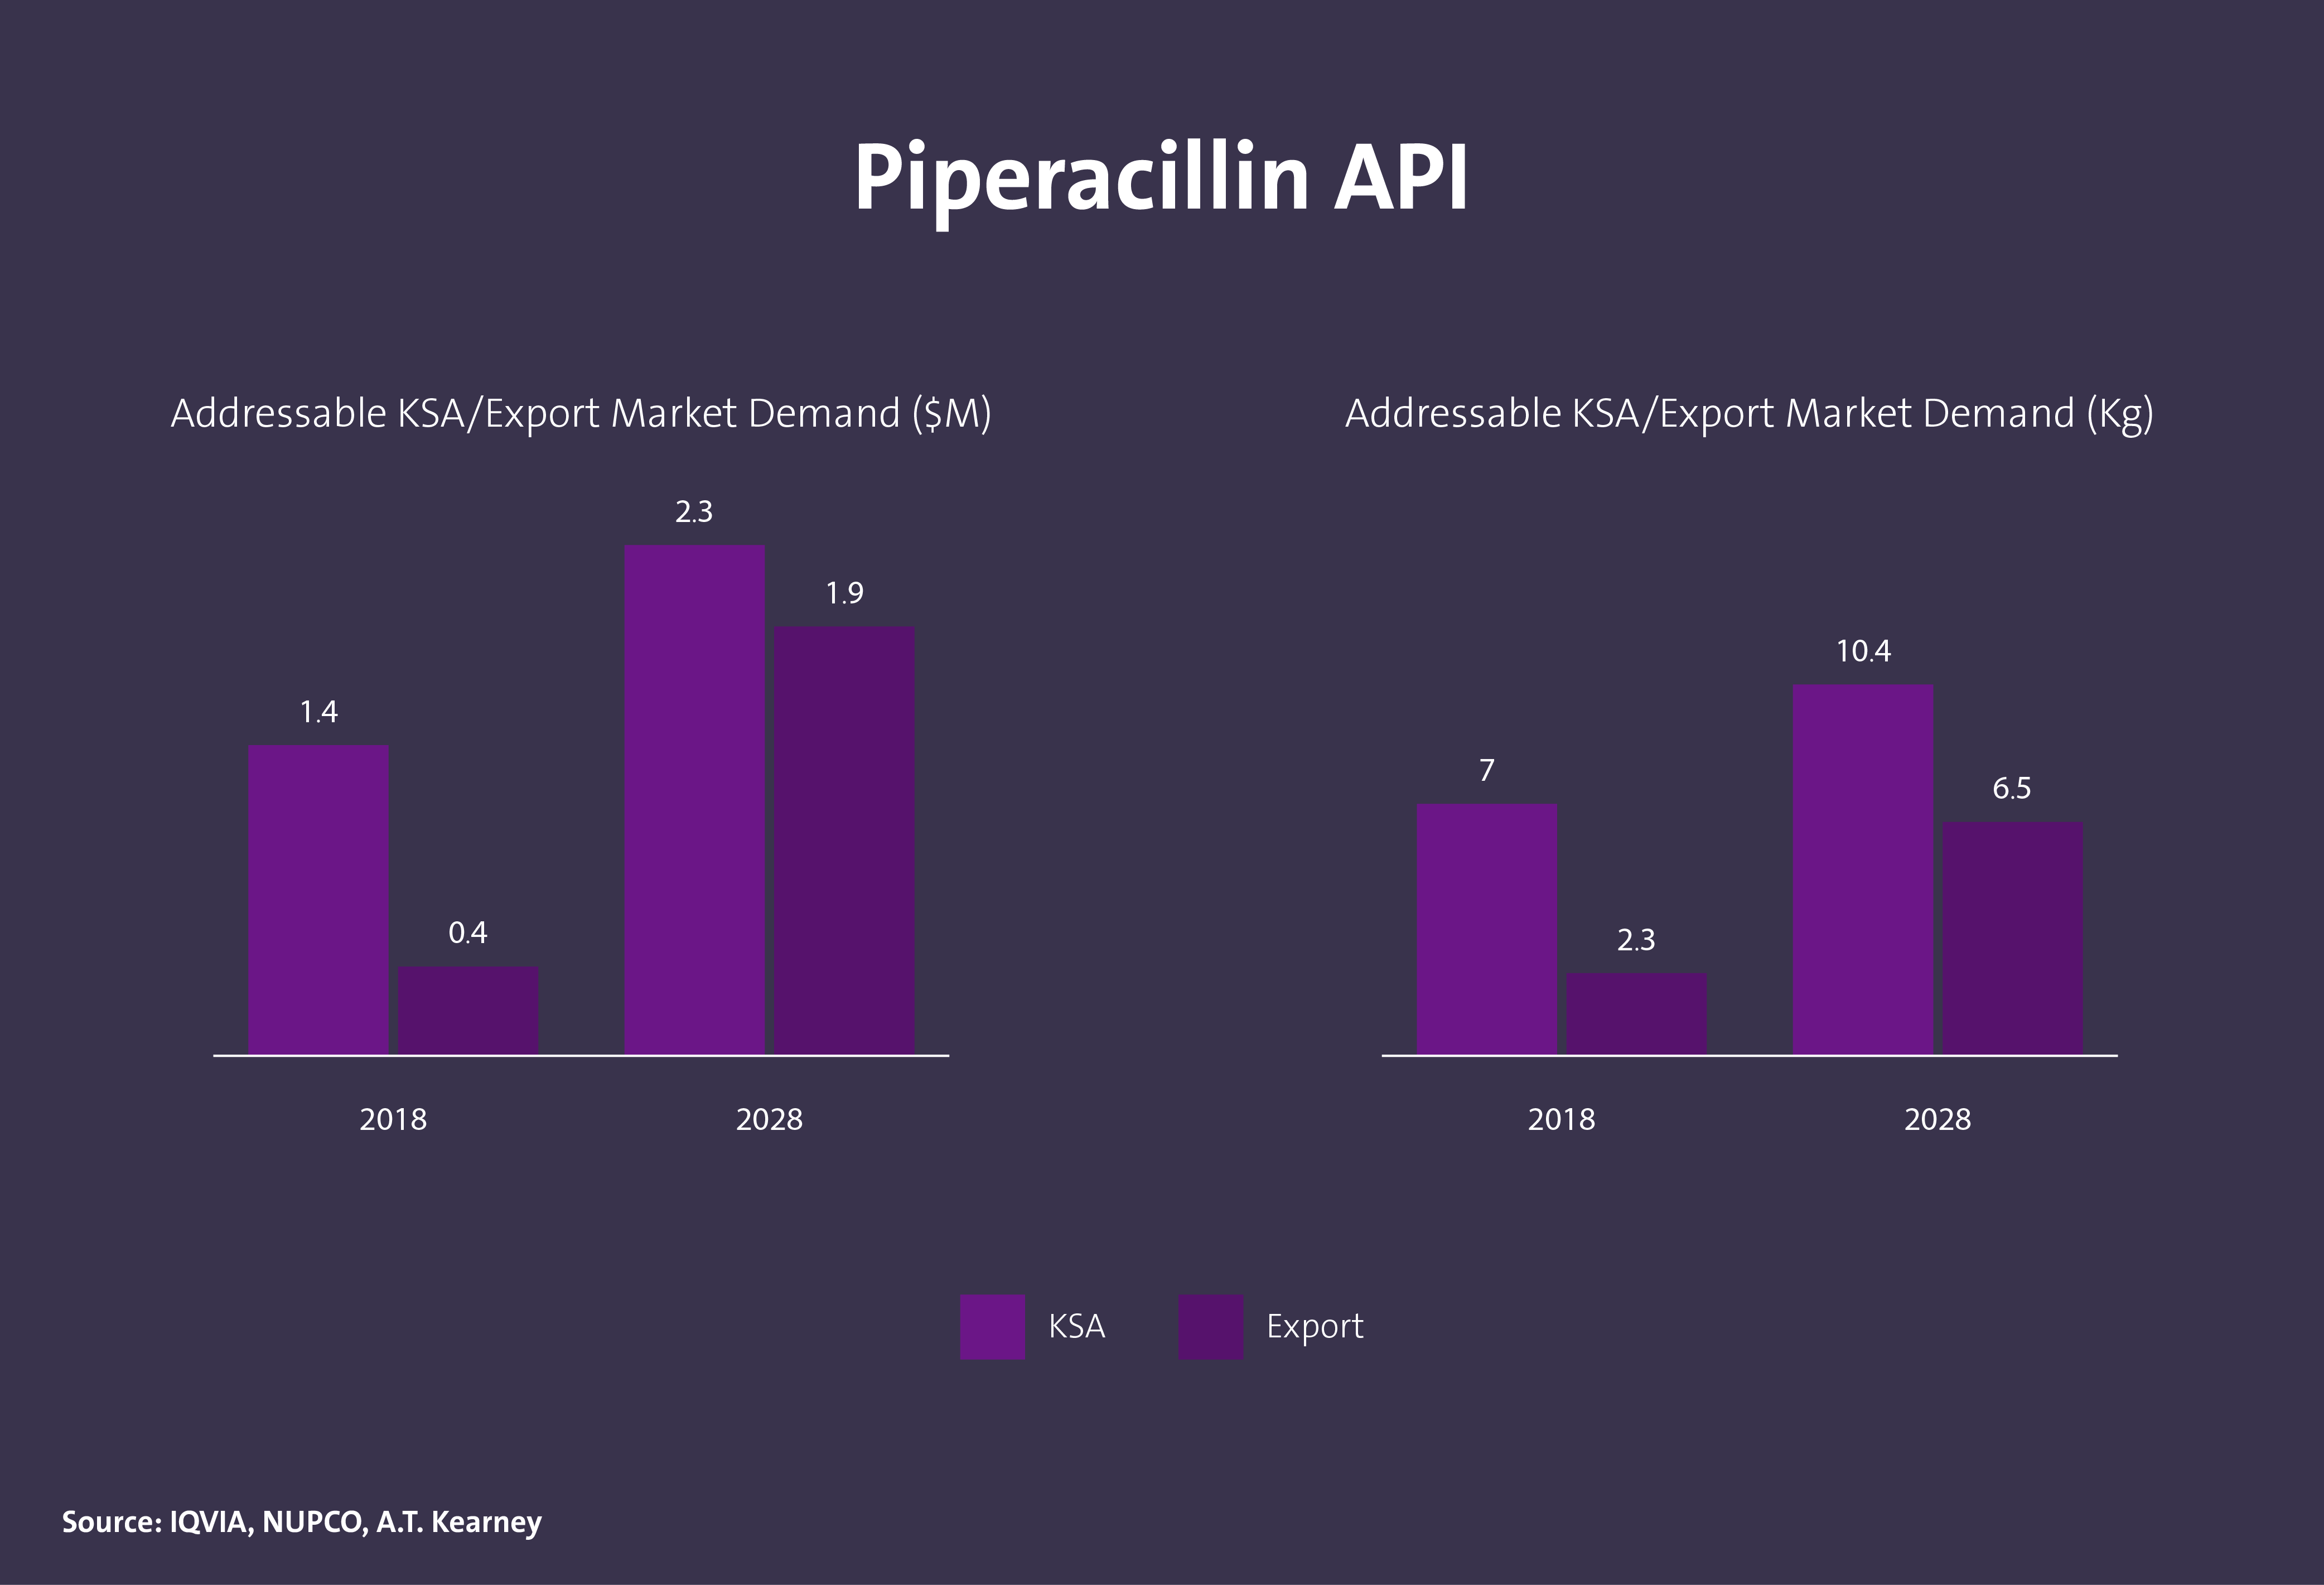
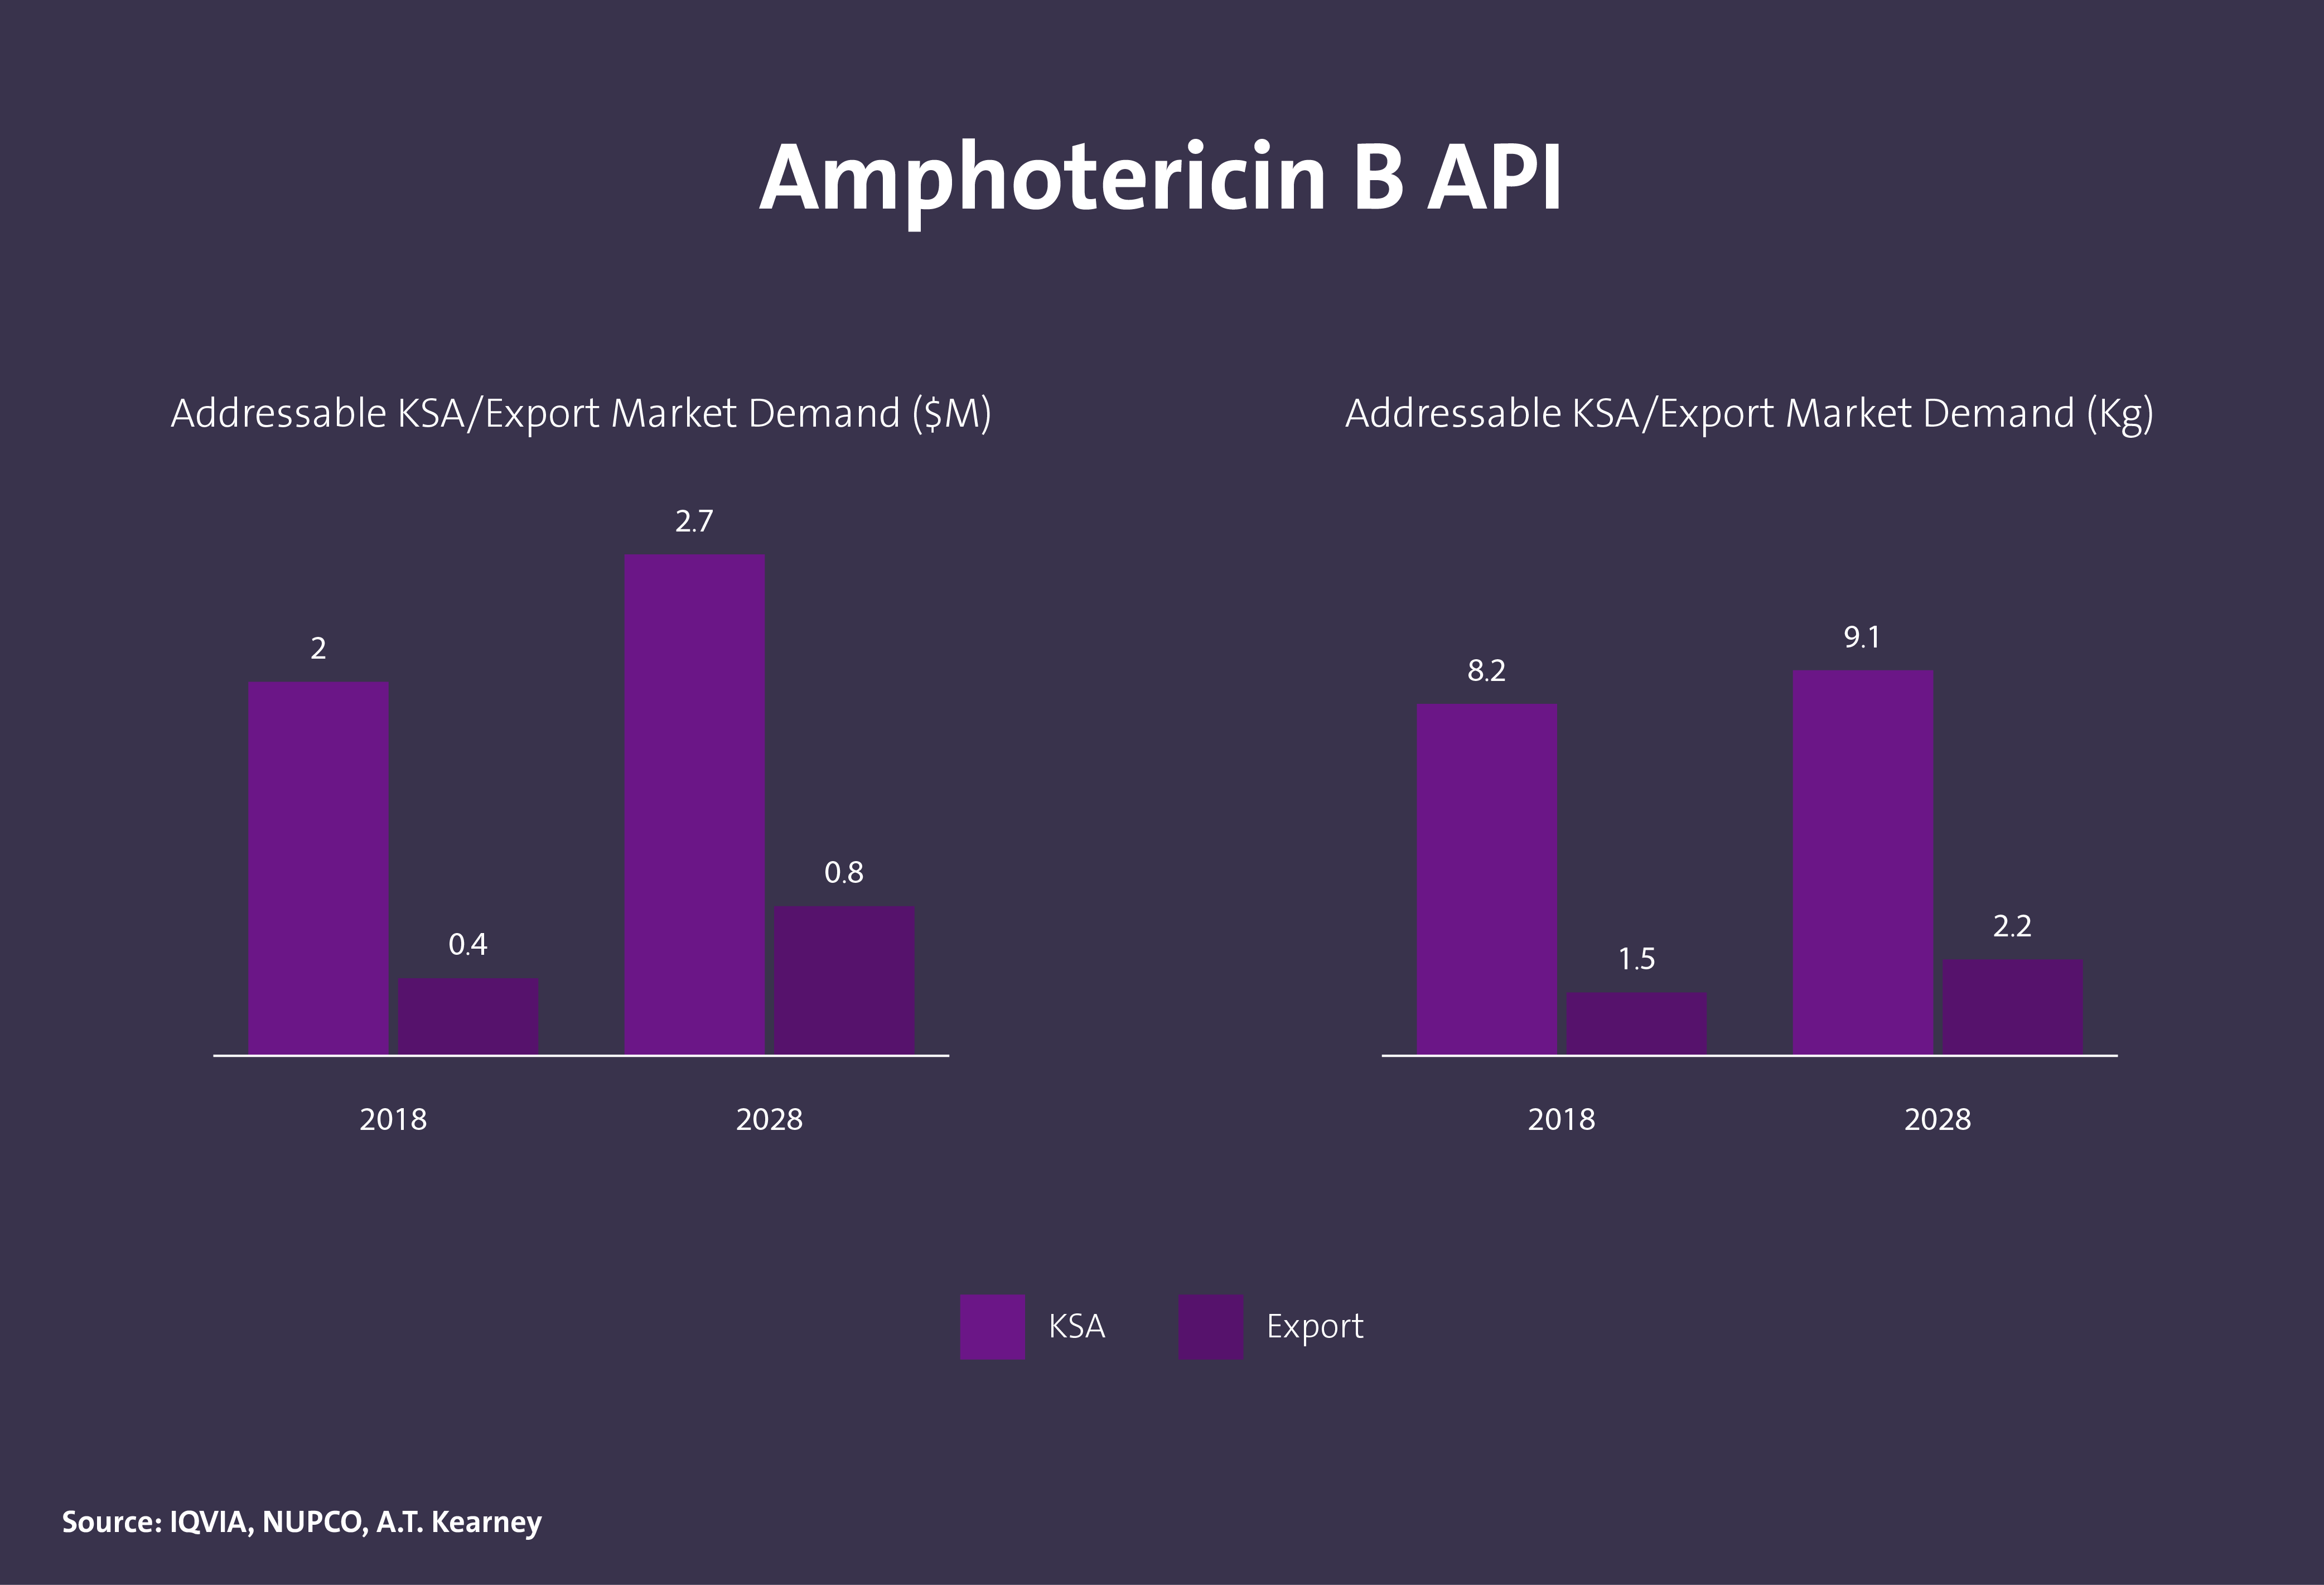
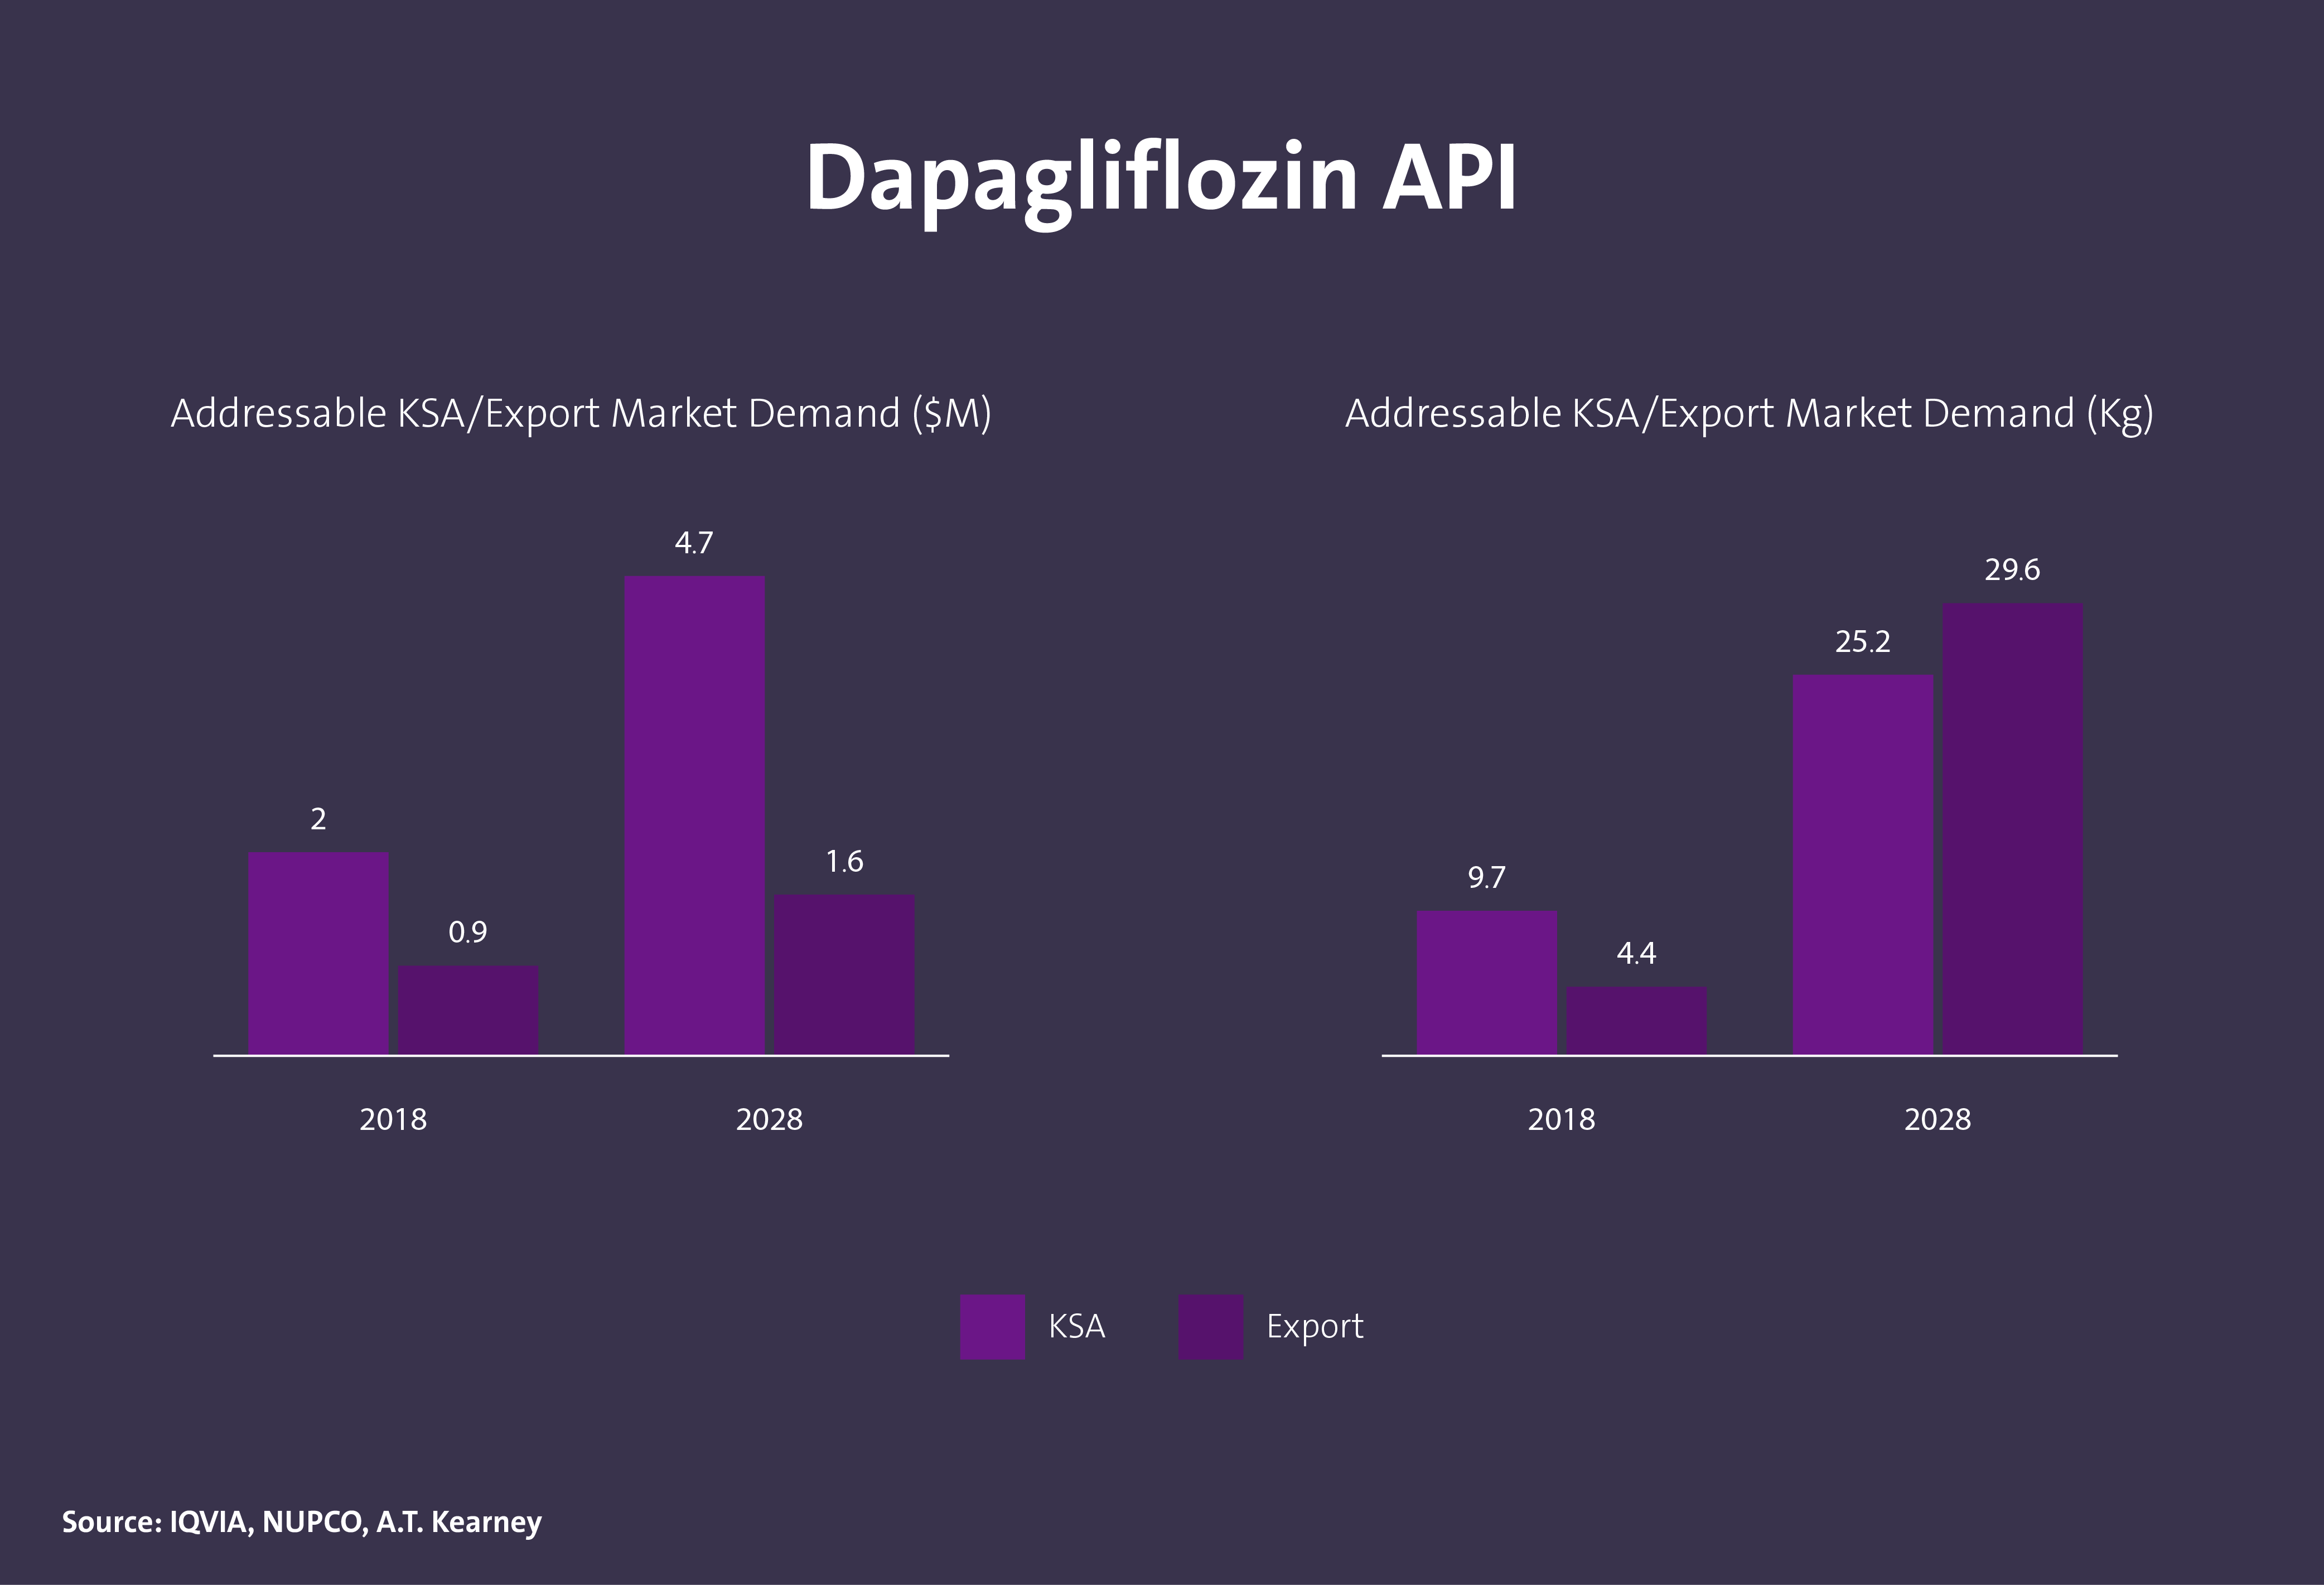
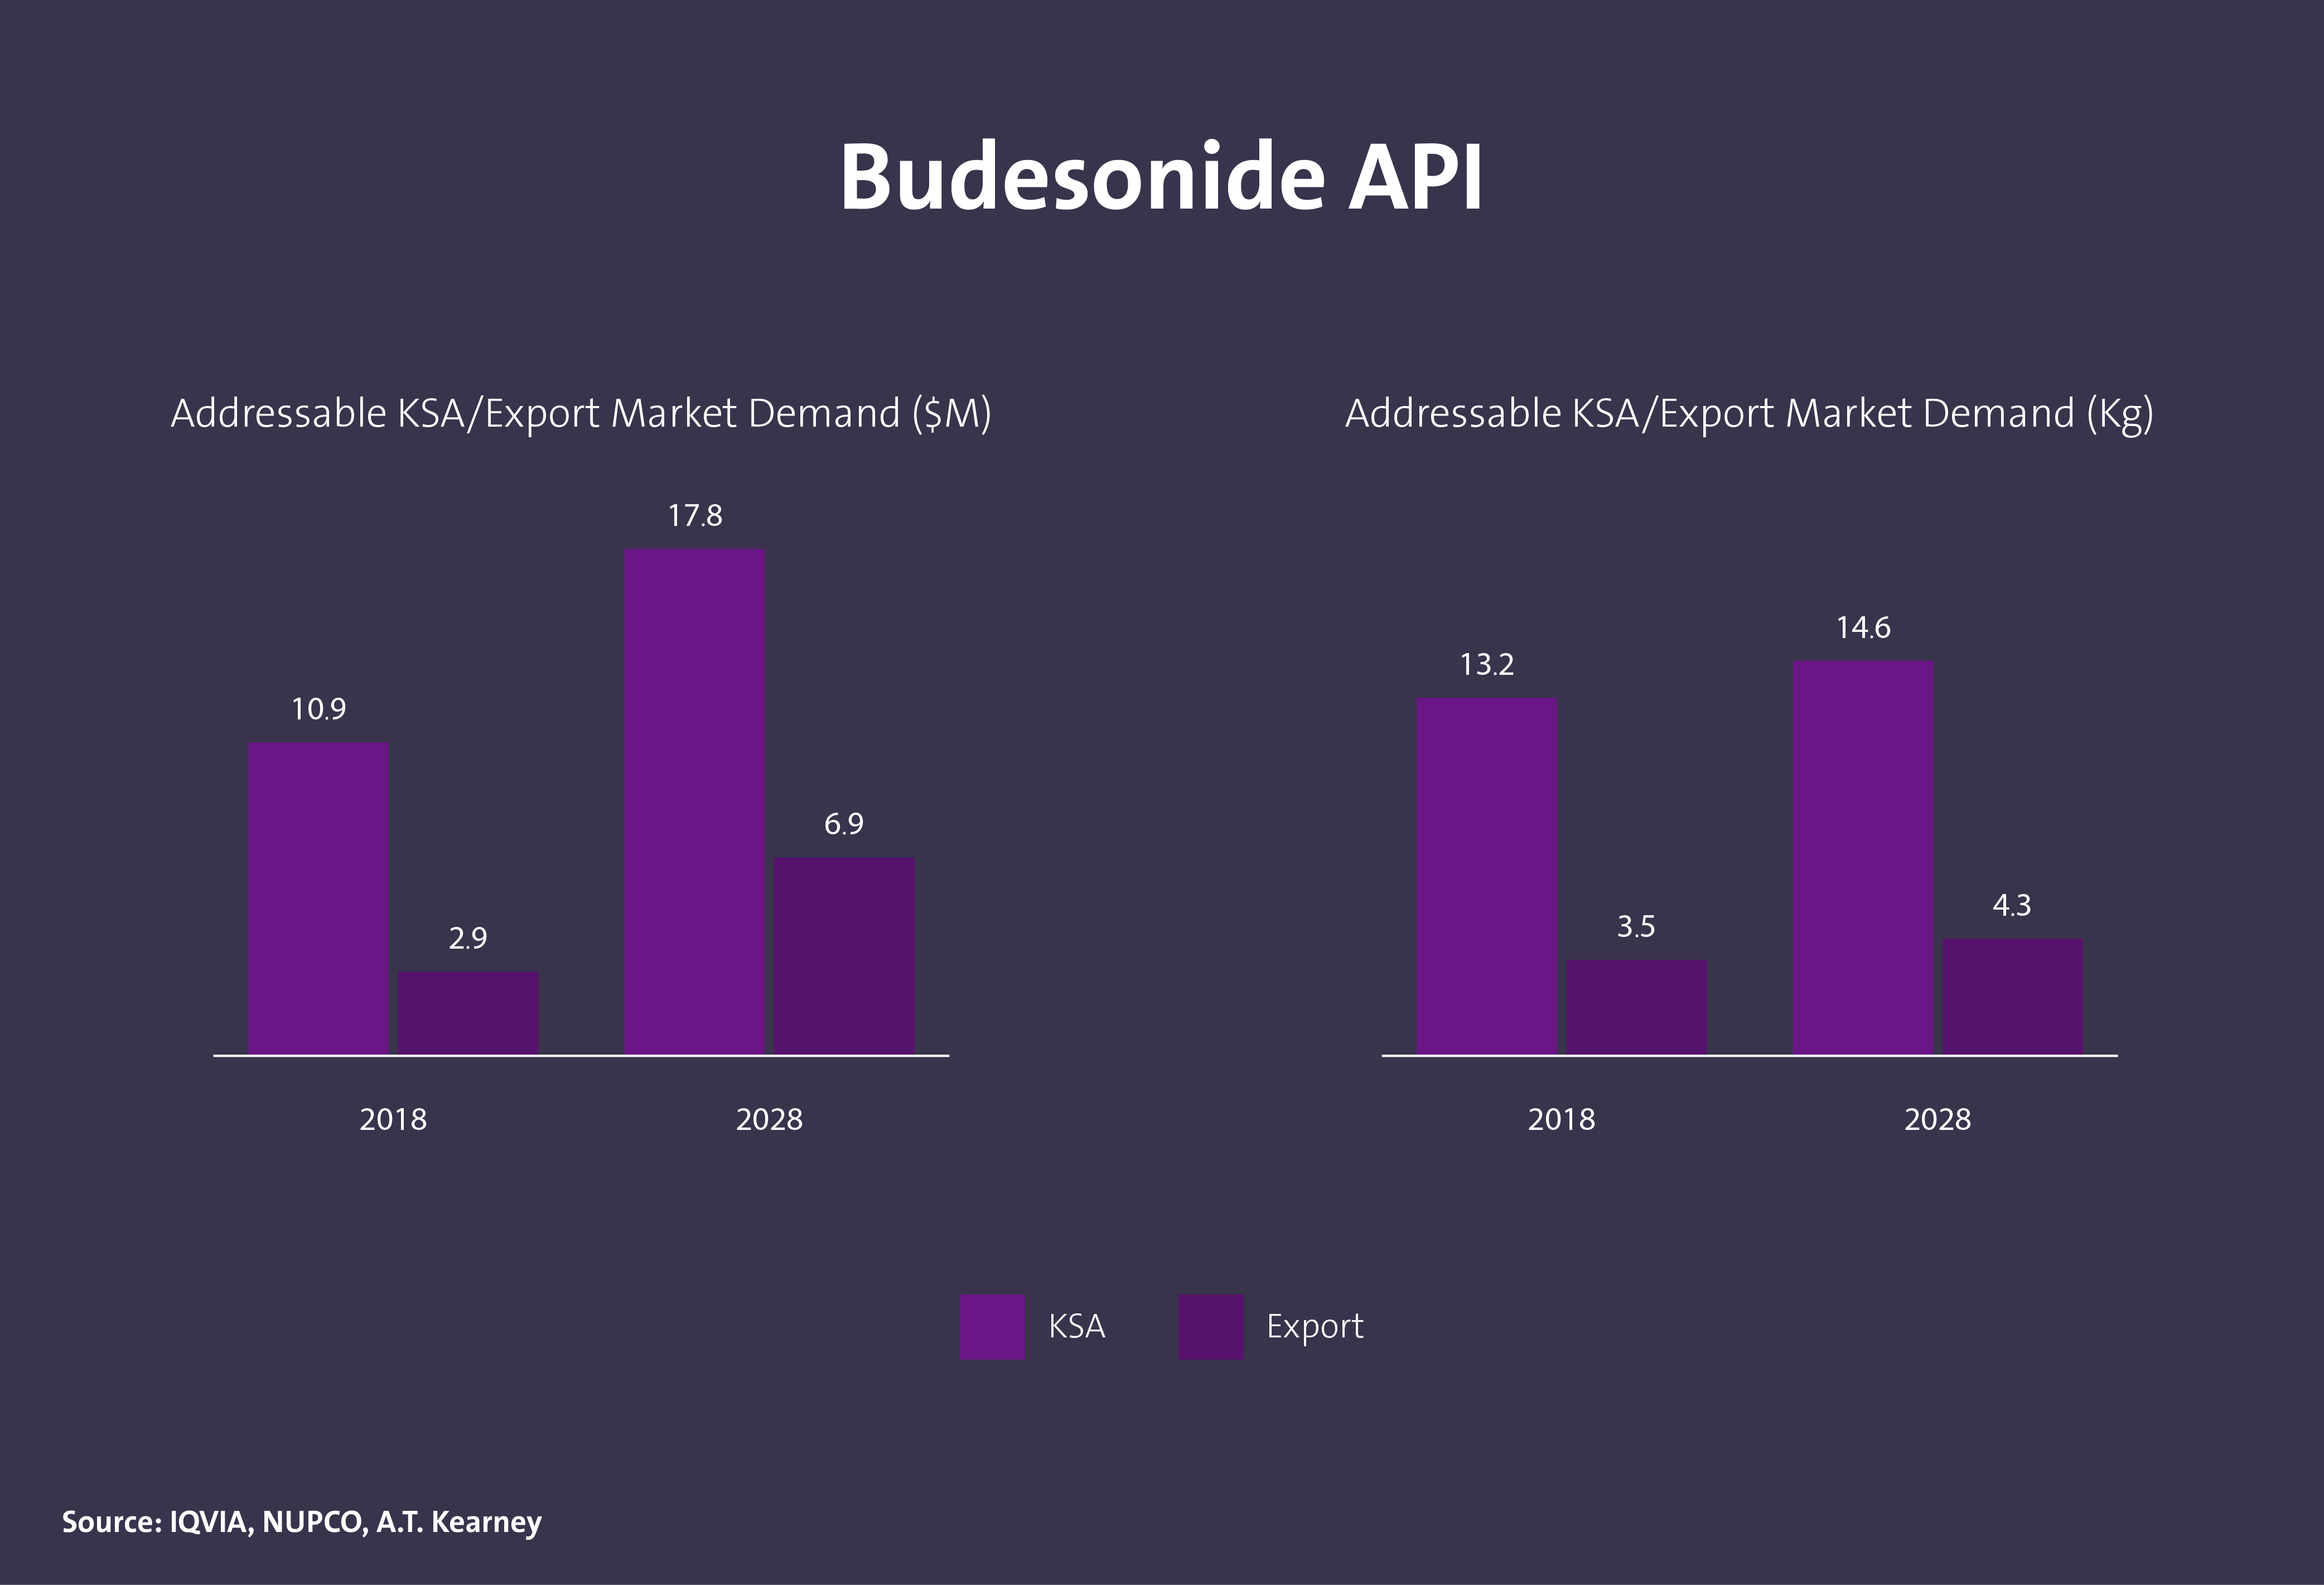
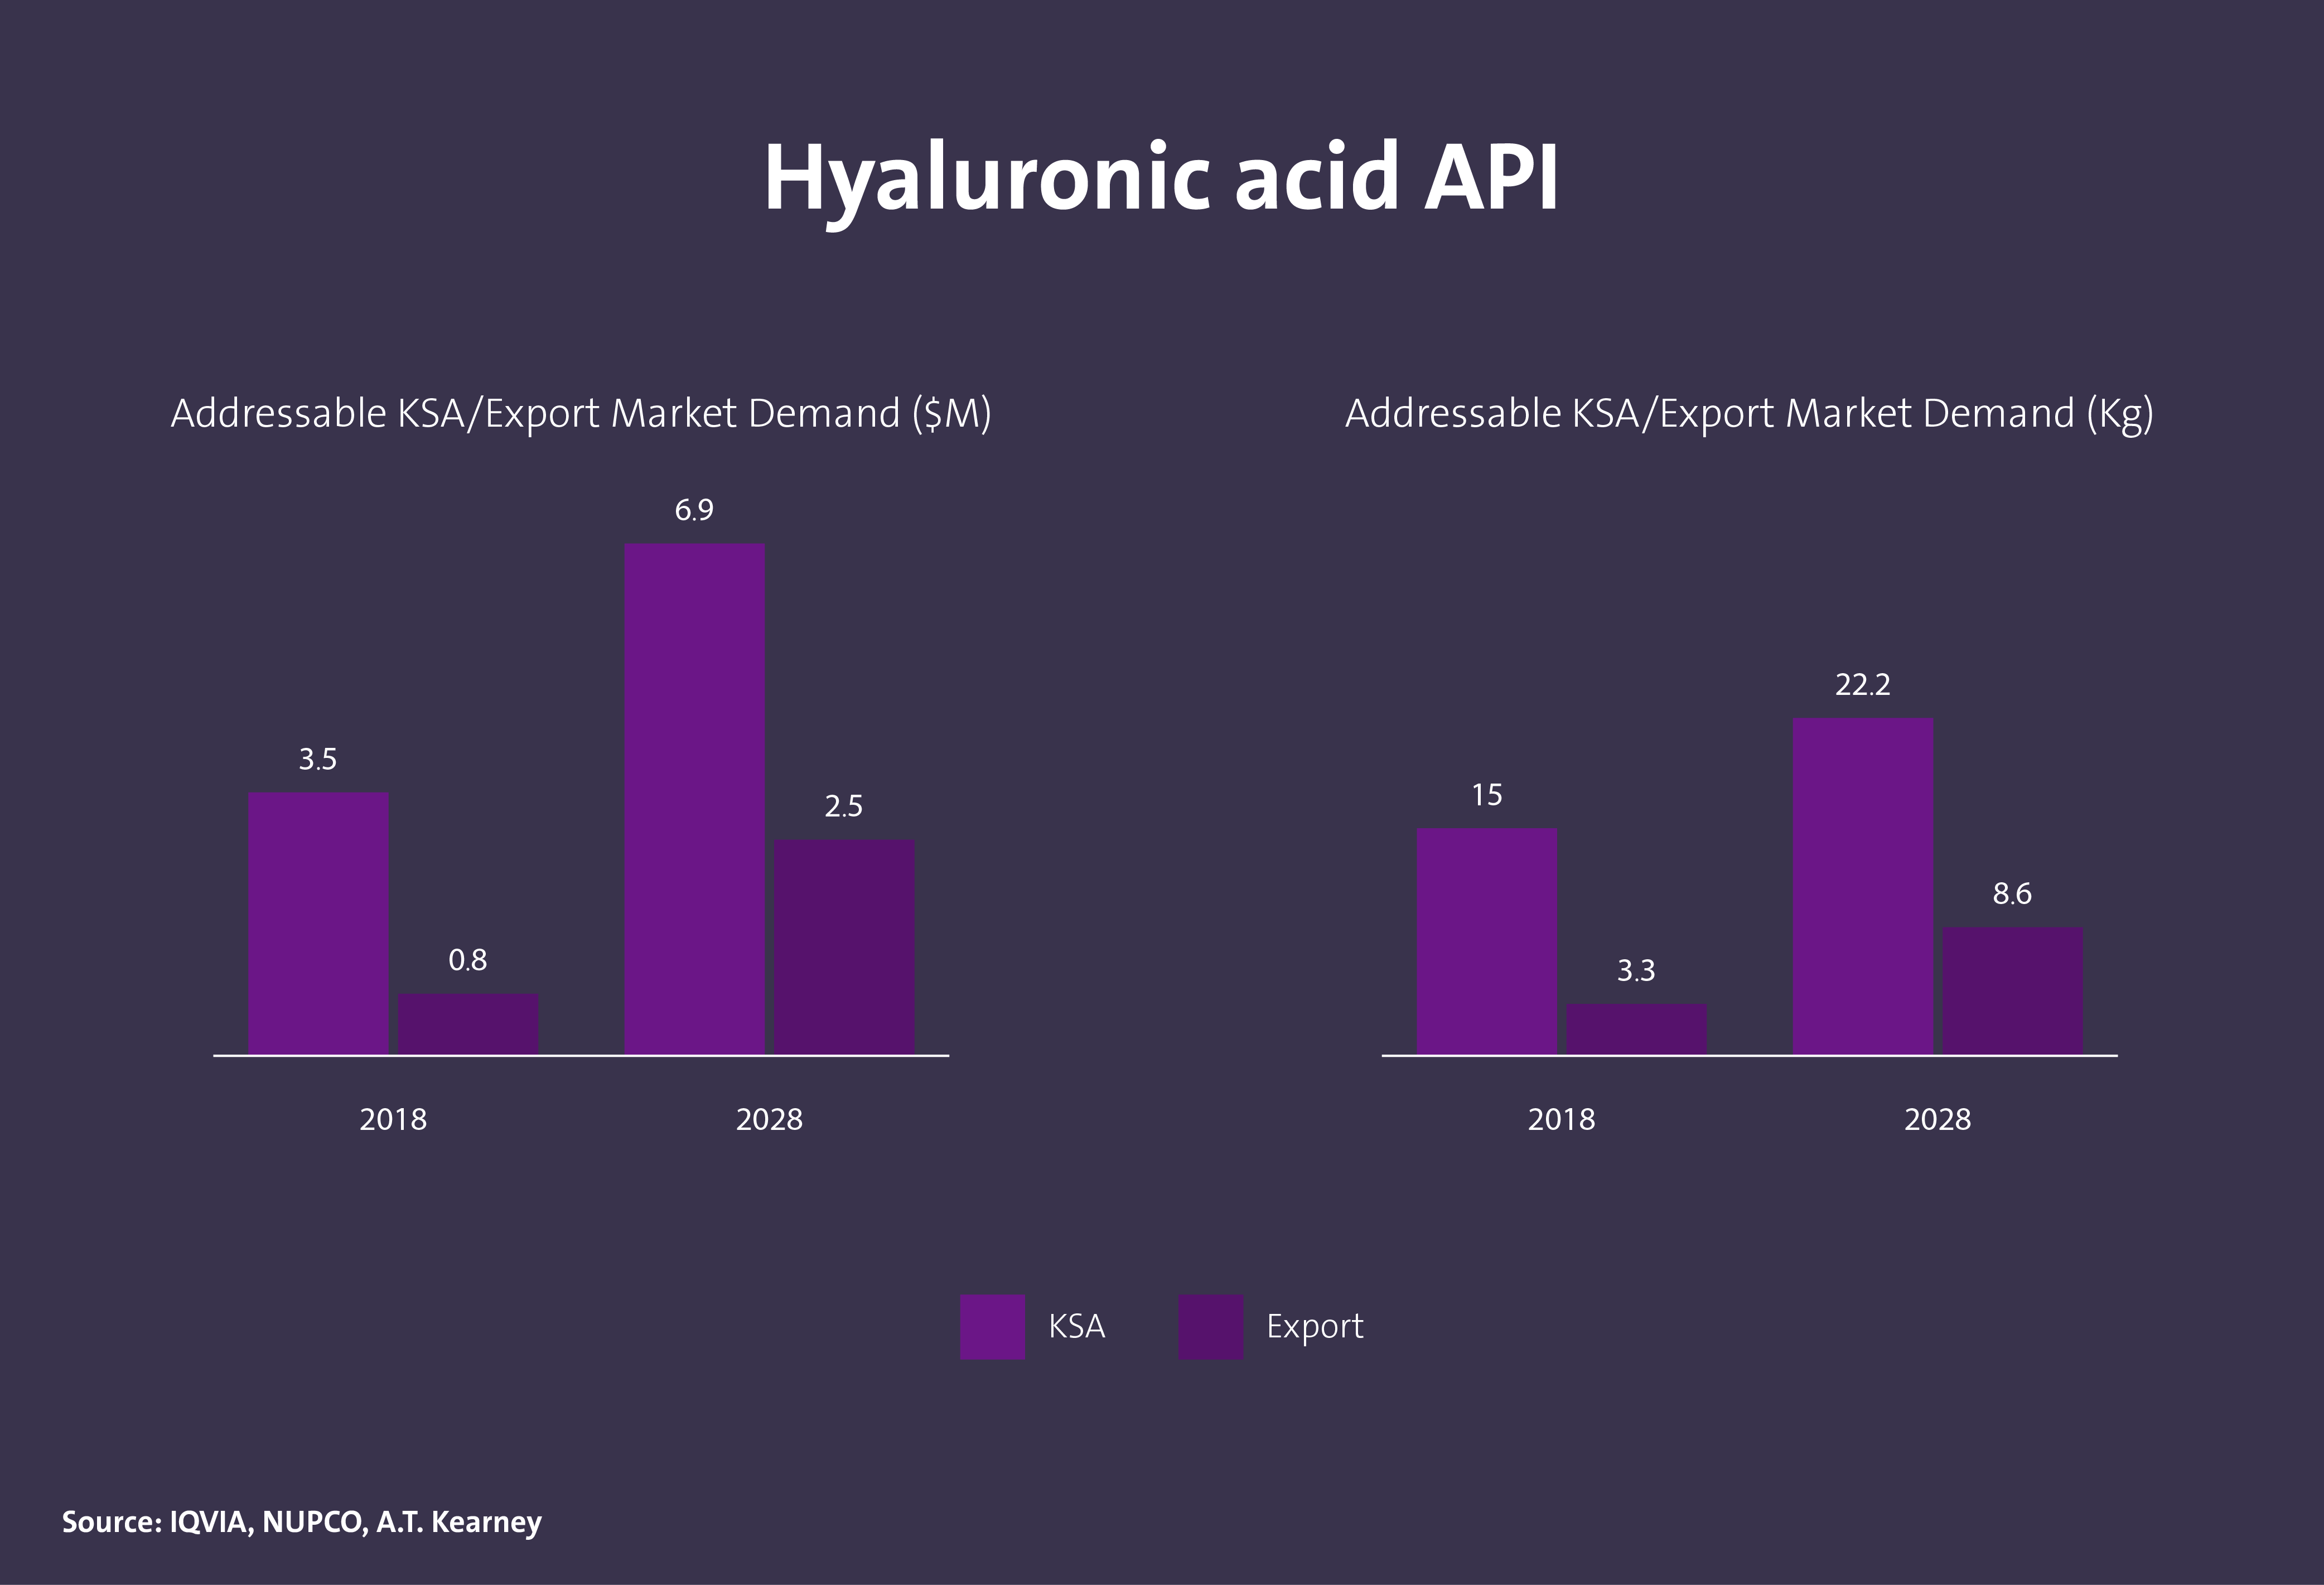
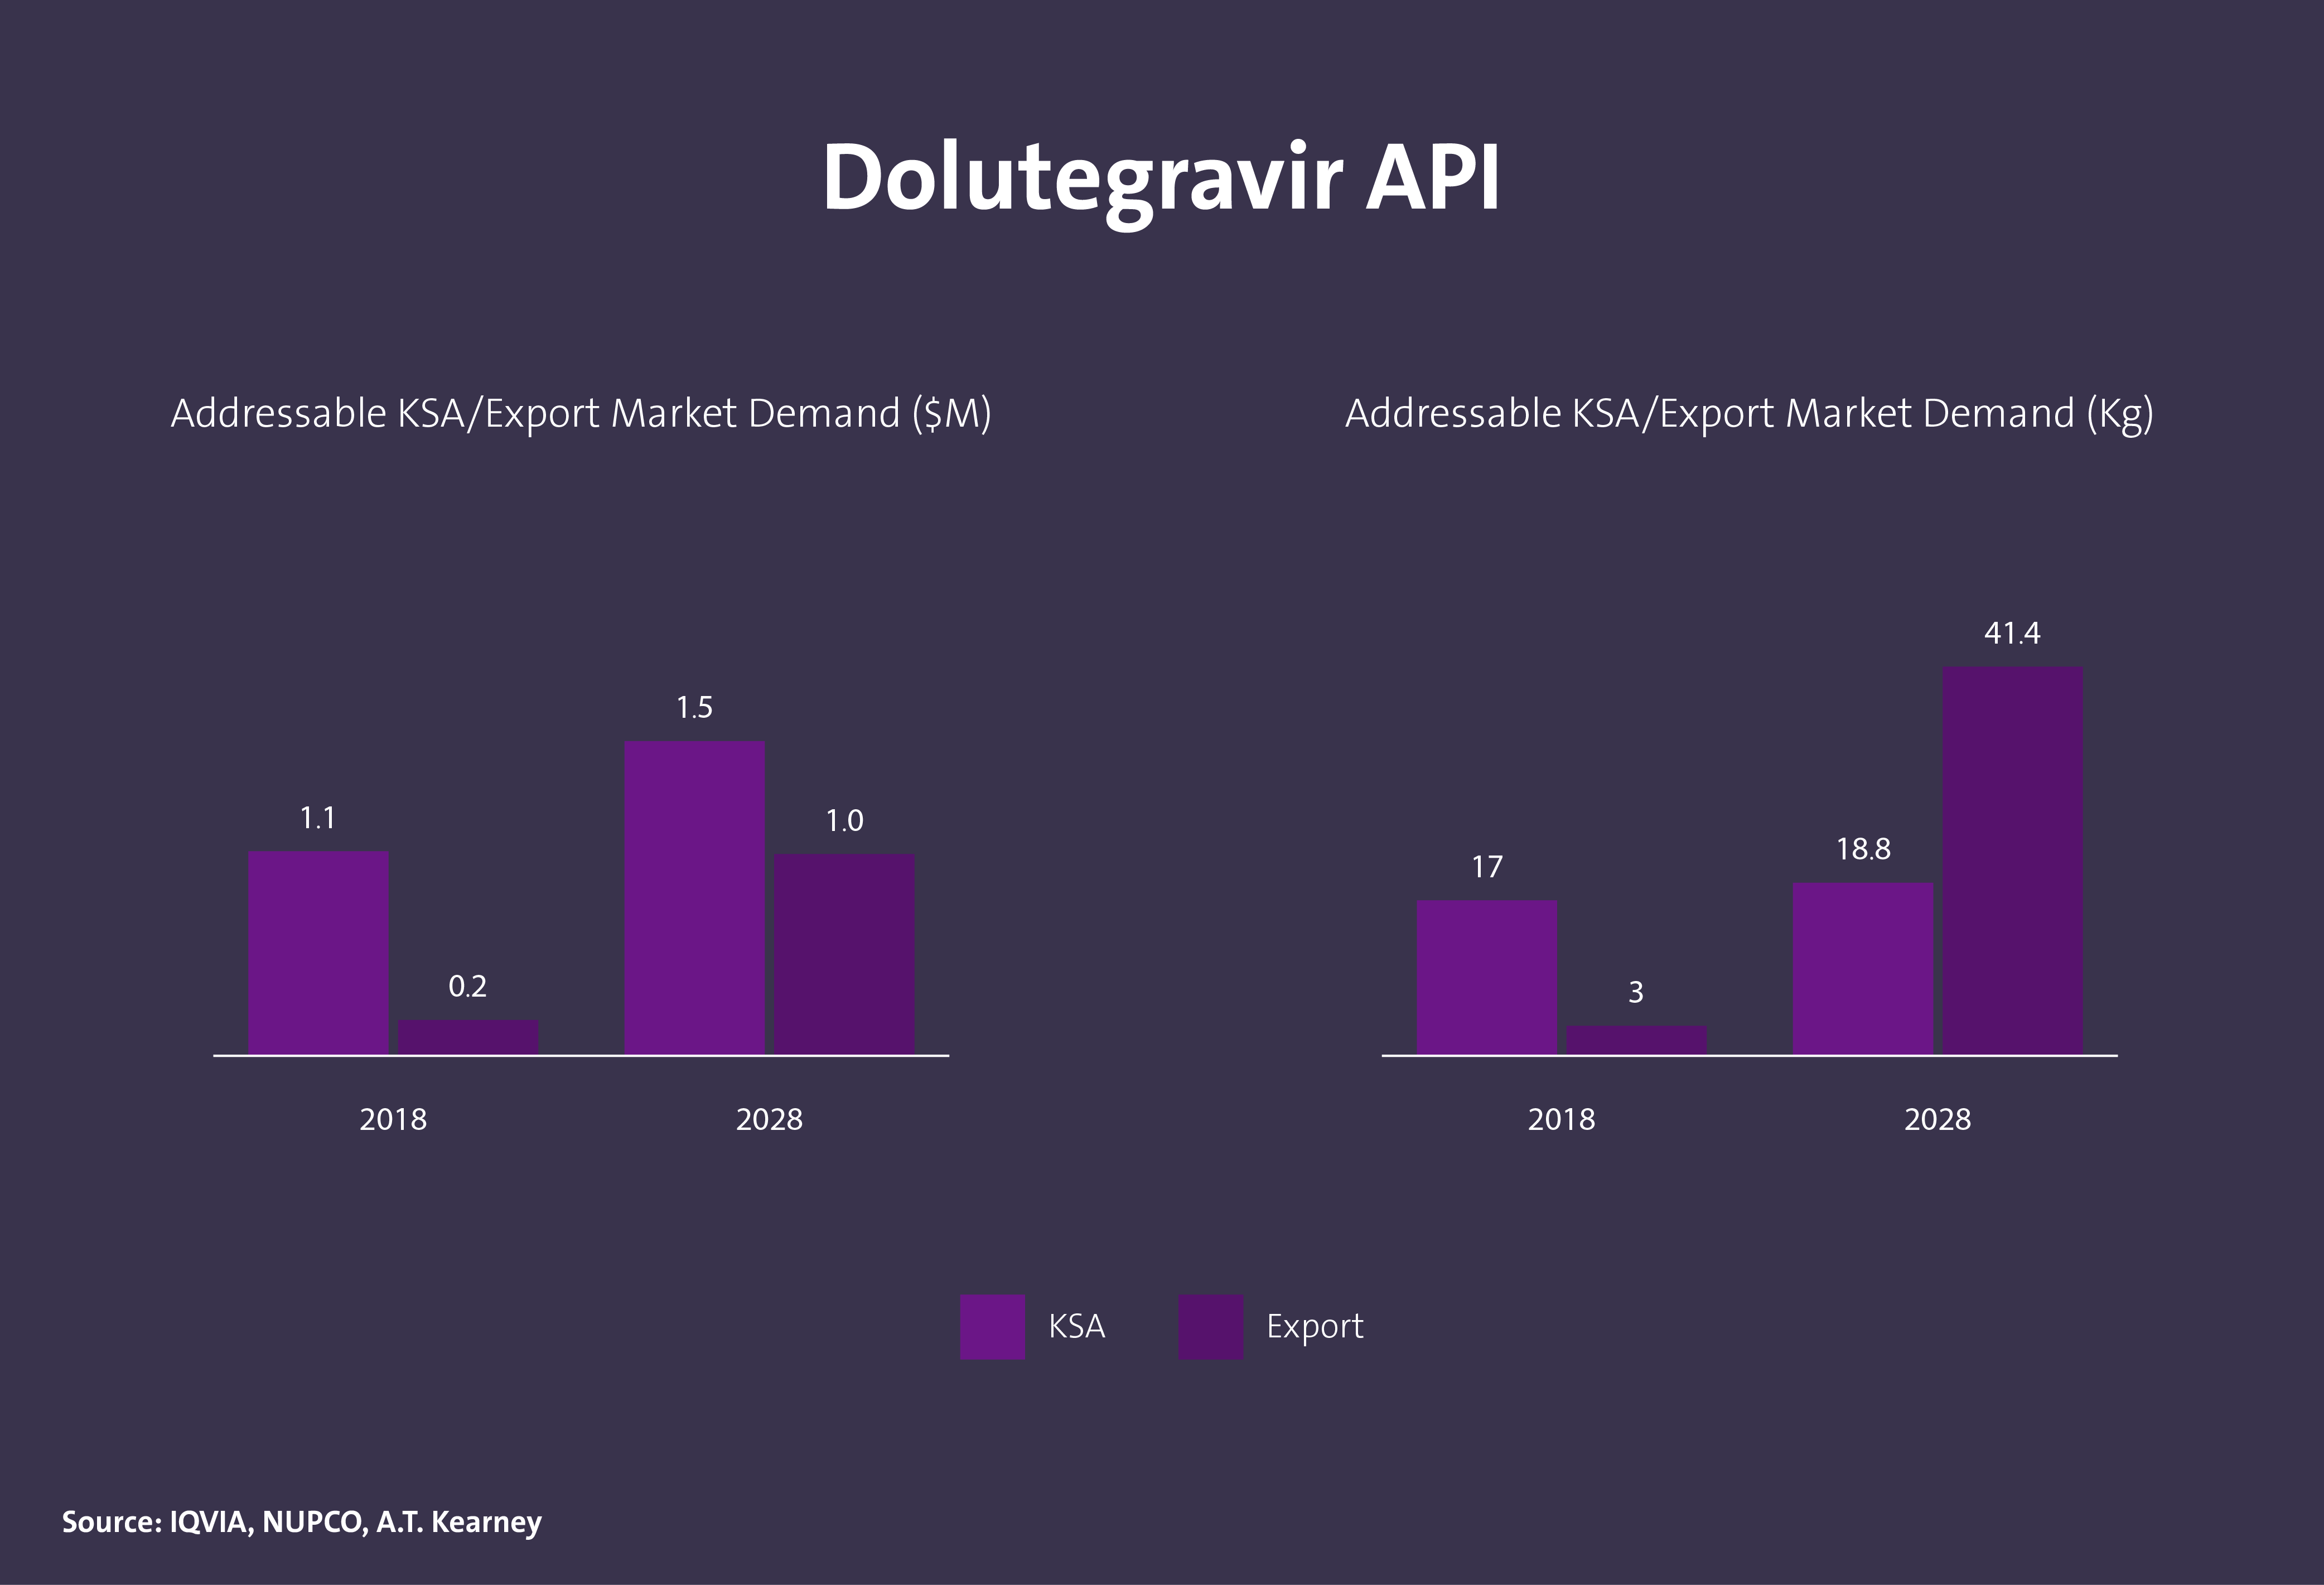
CHEMICALS ACTIVE PHARMACEUTICAL INGREDIENT
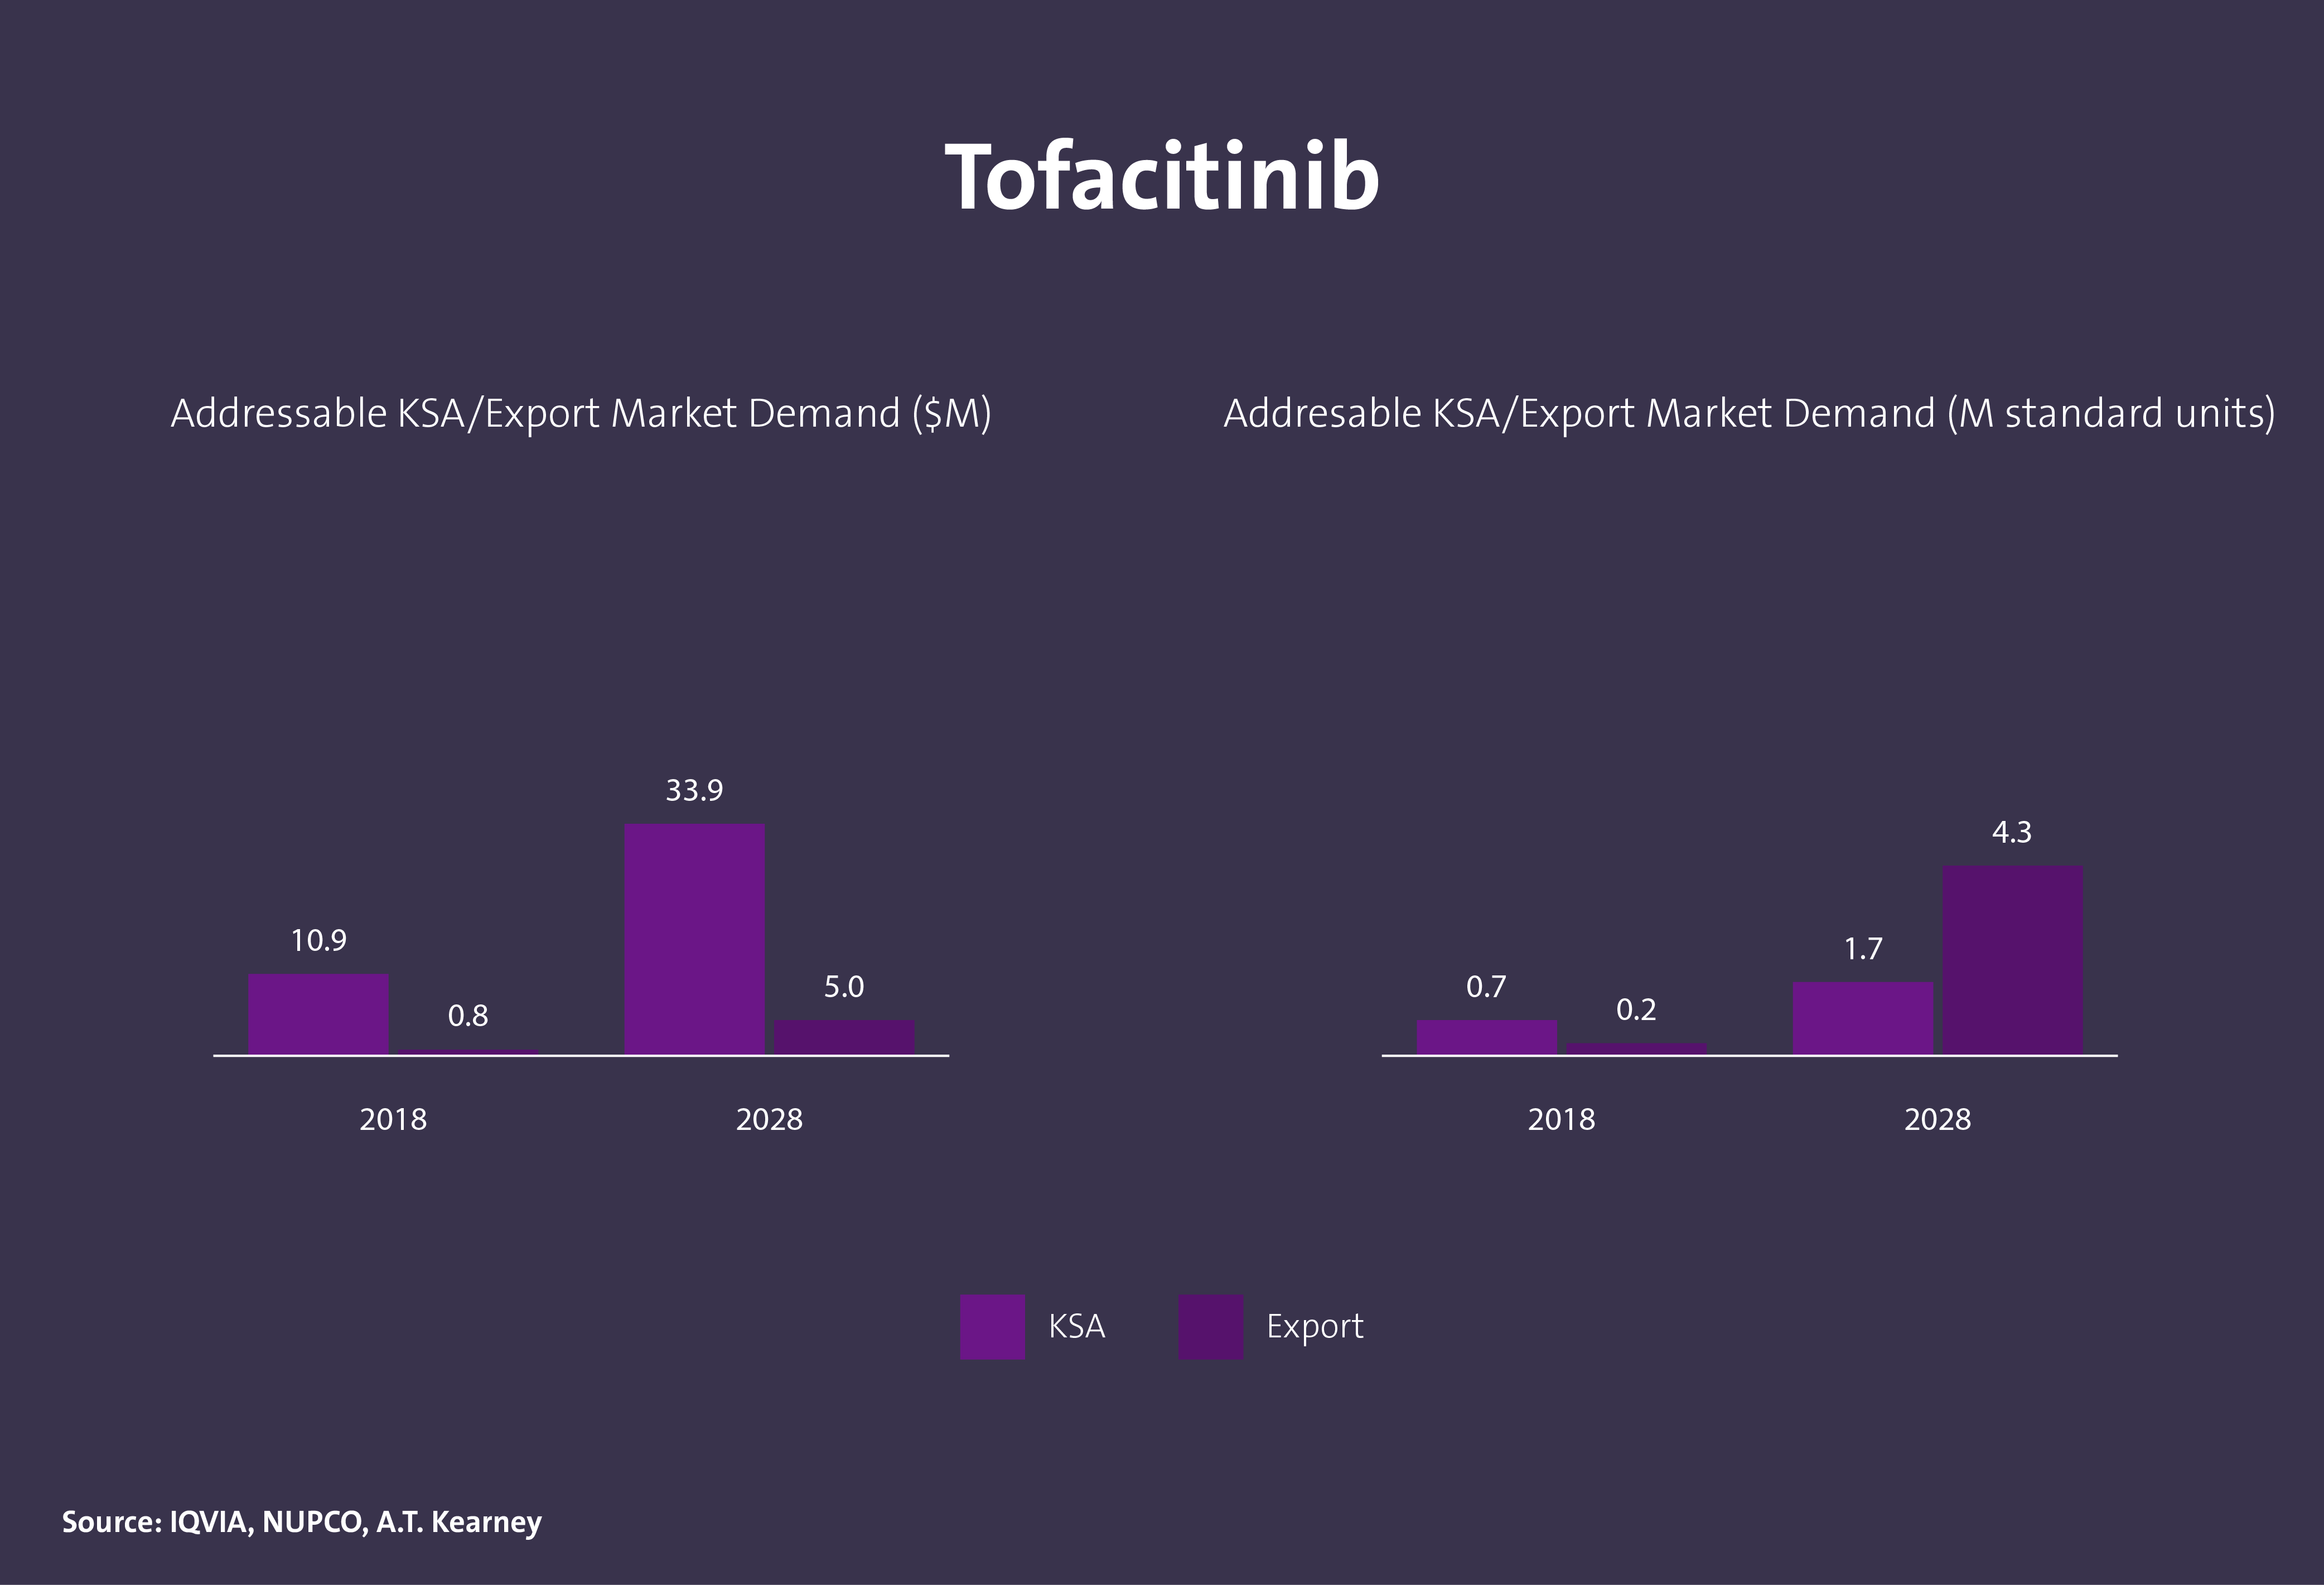
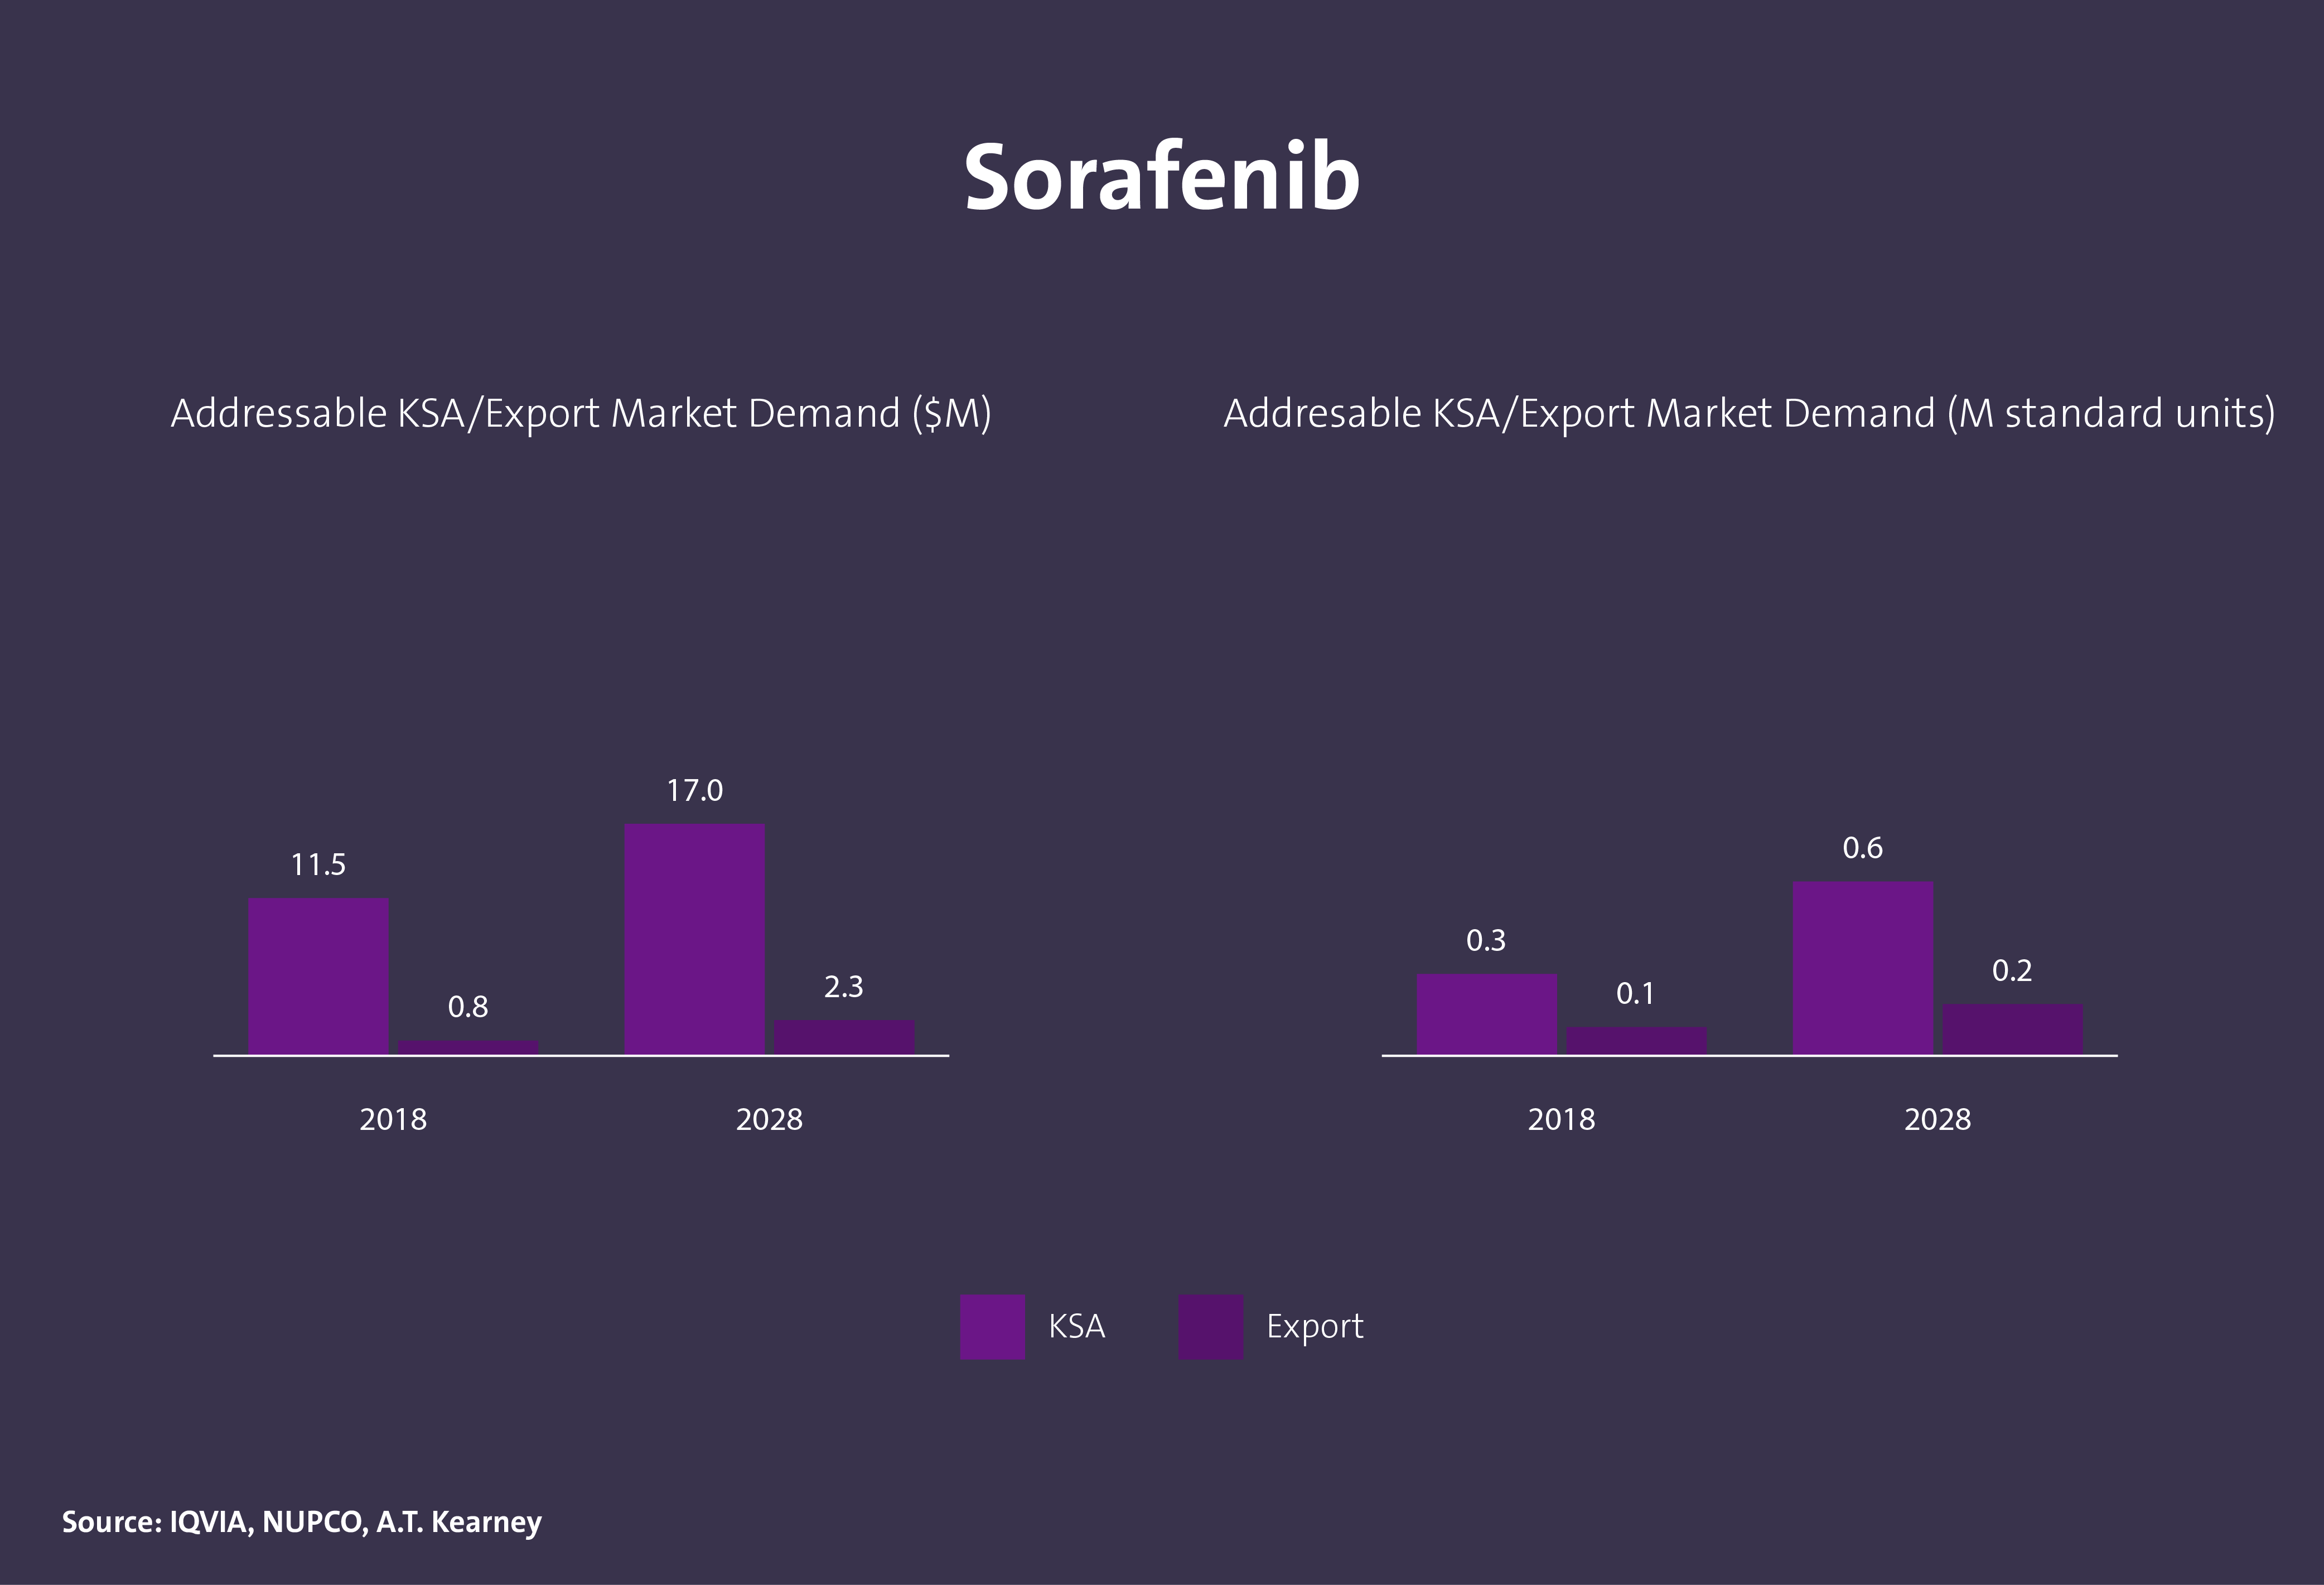

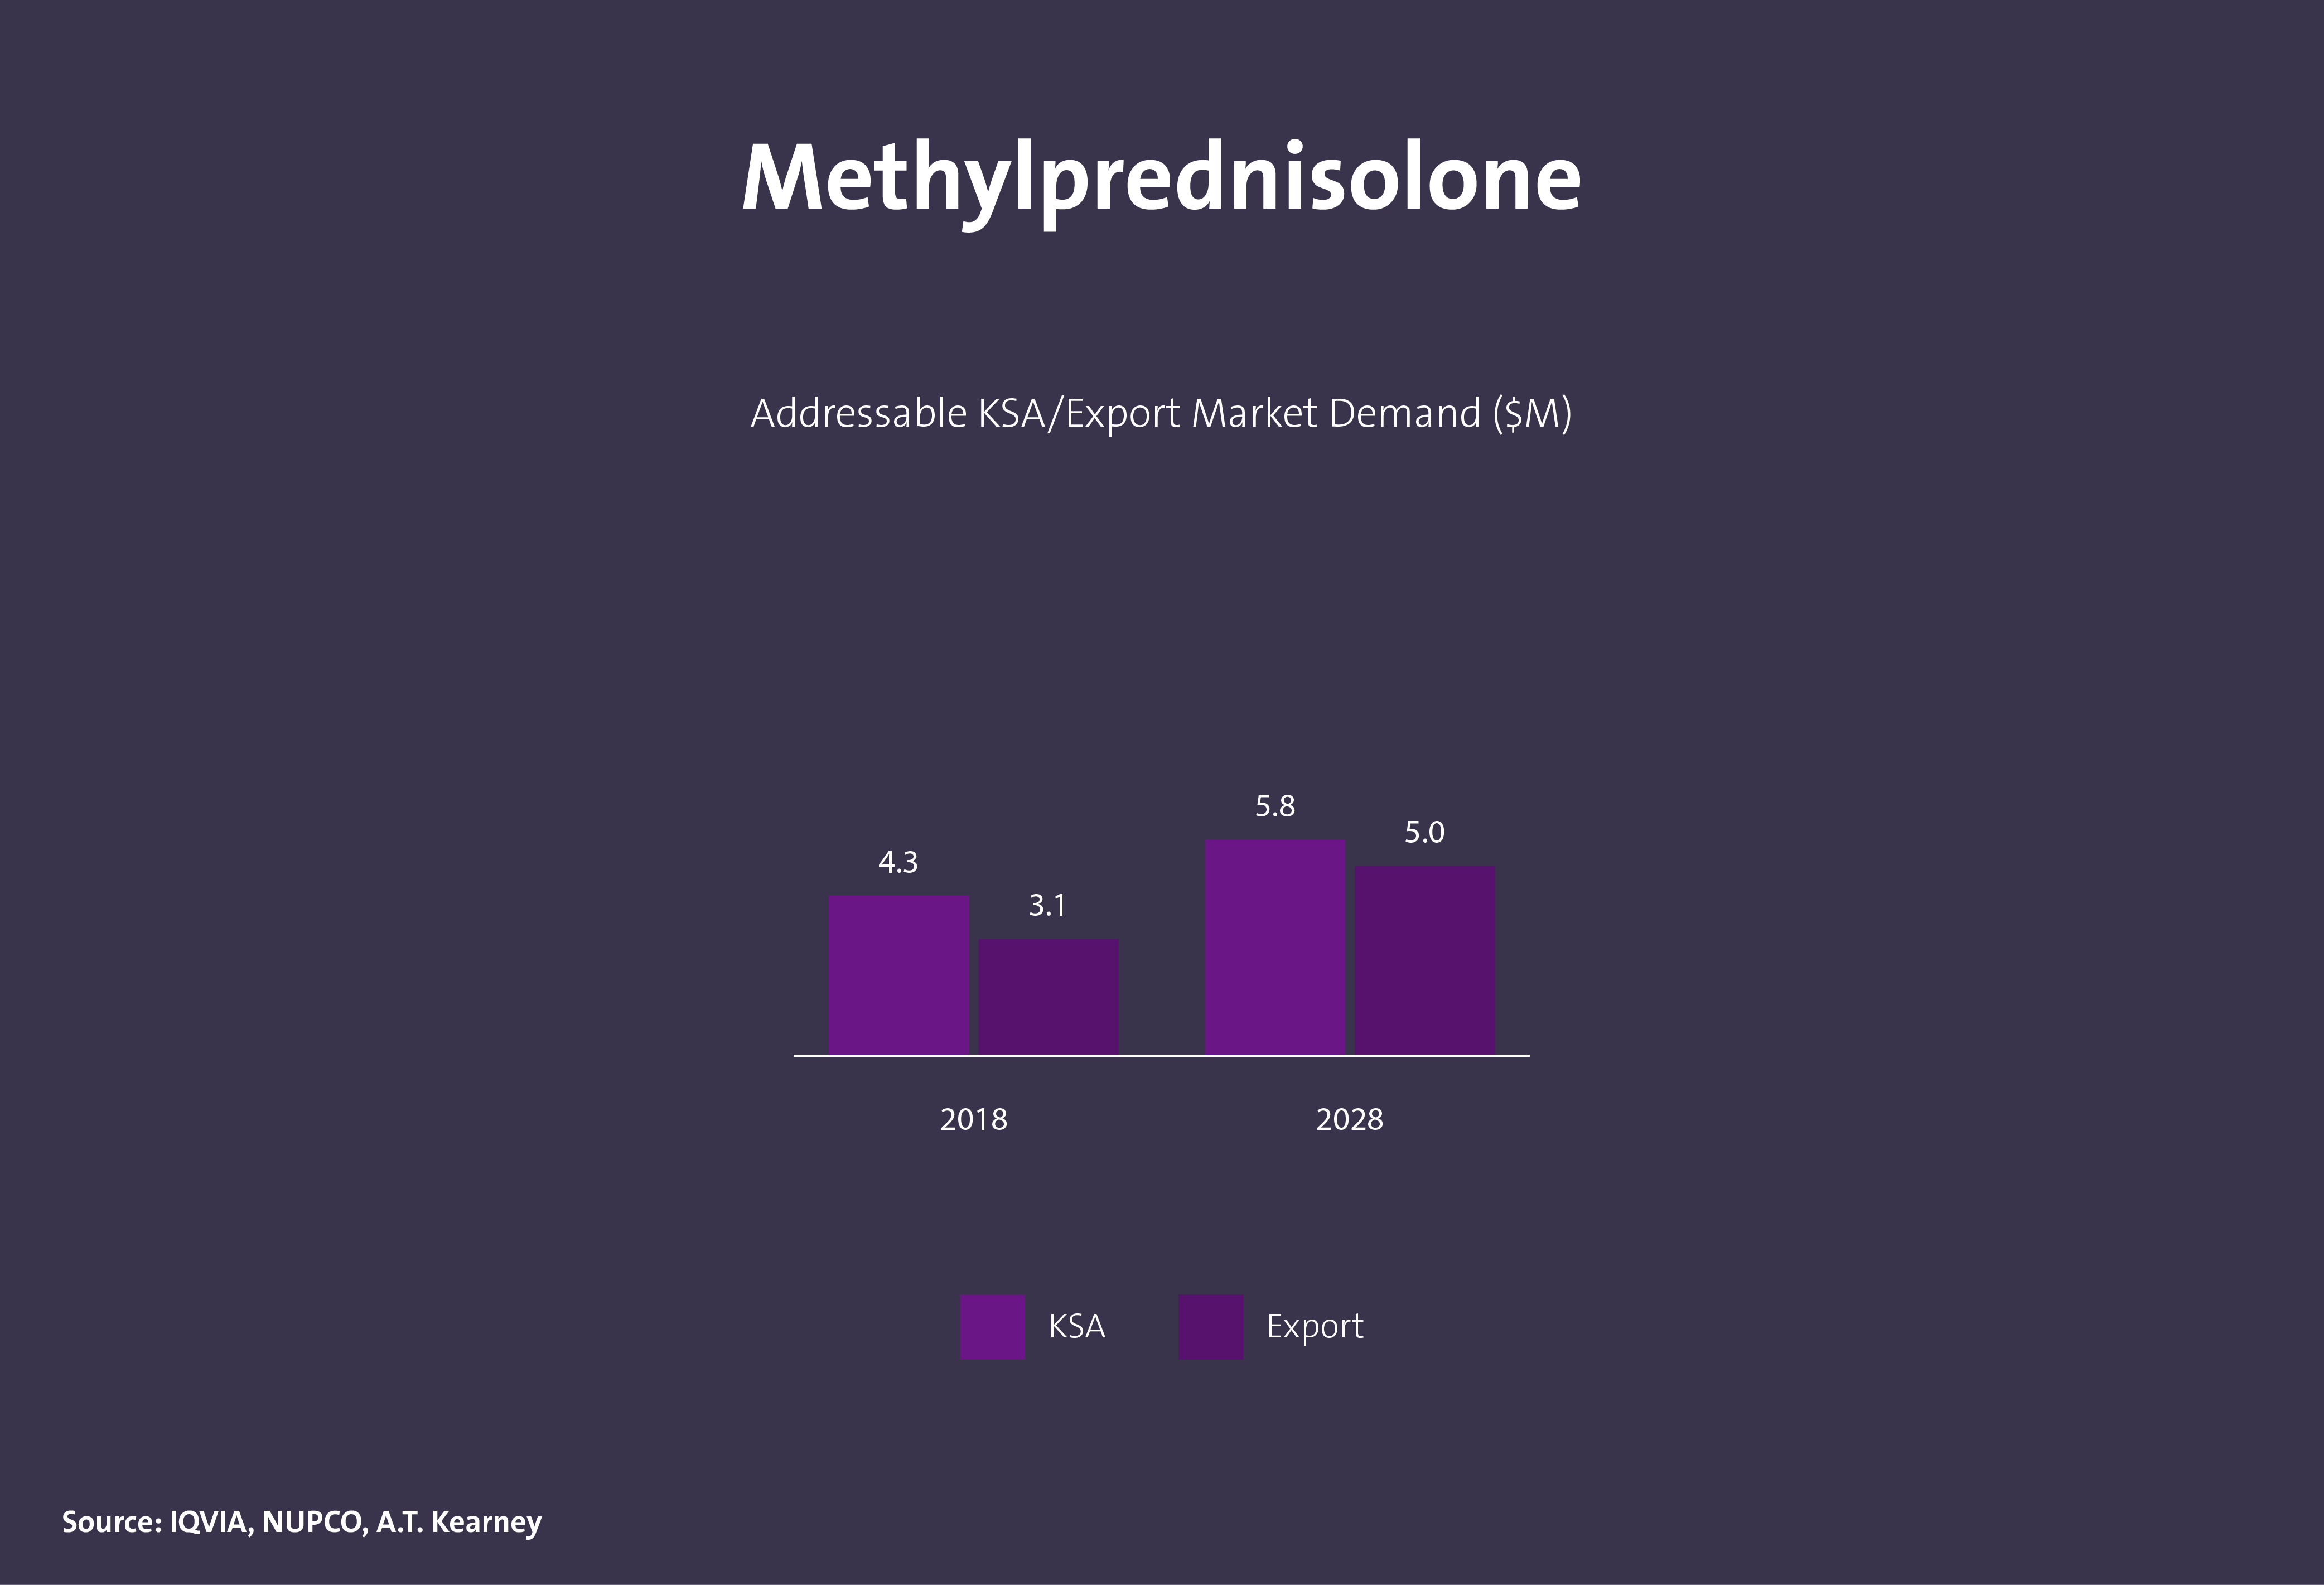
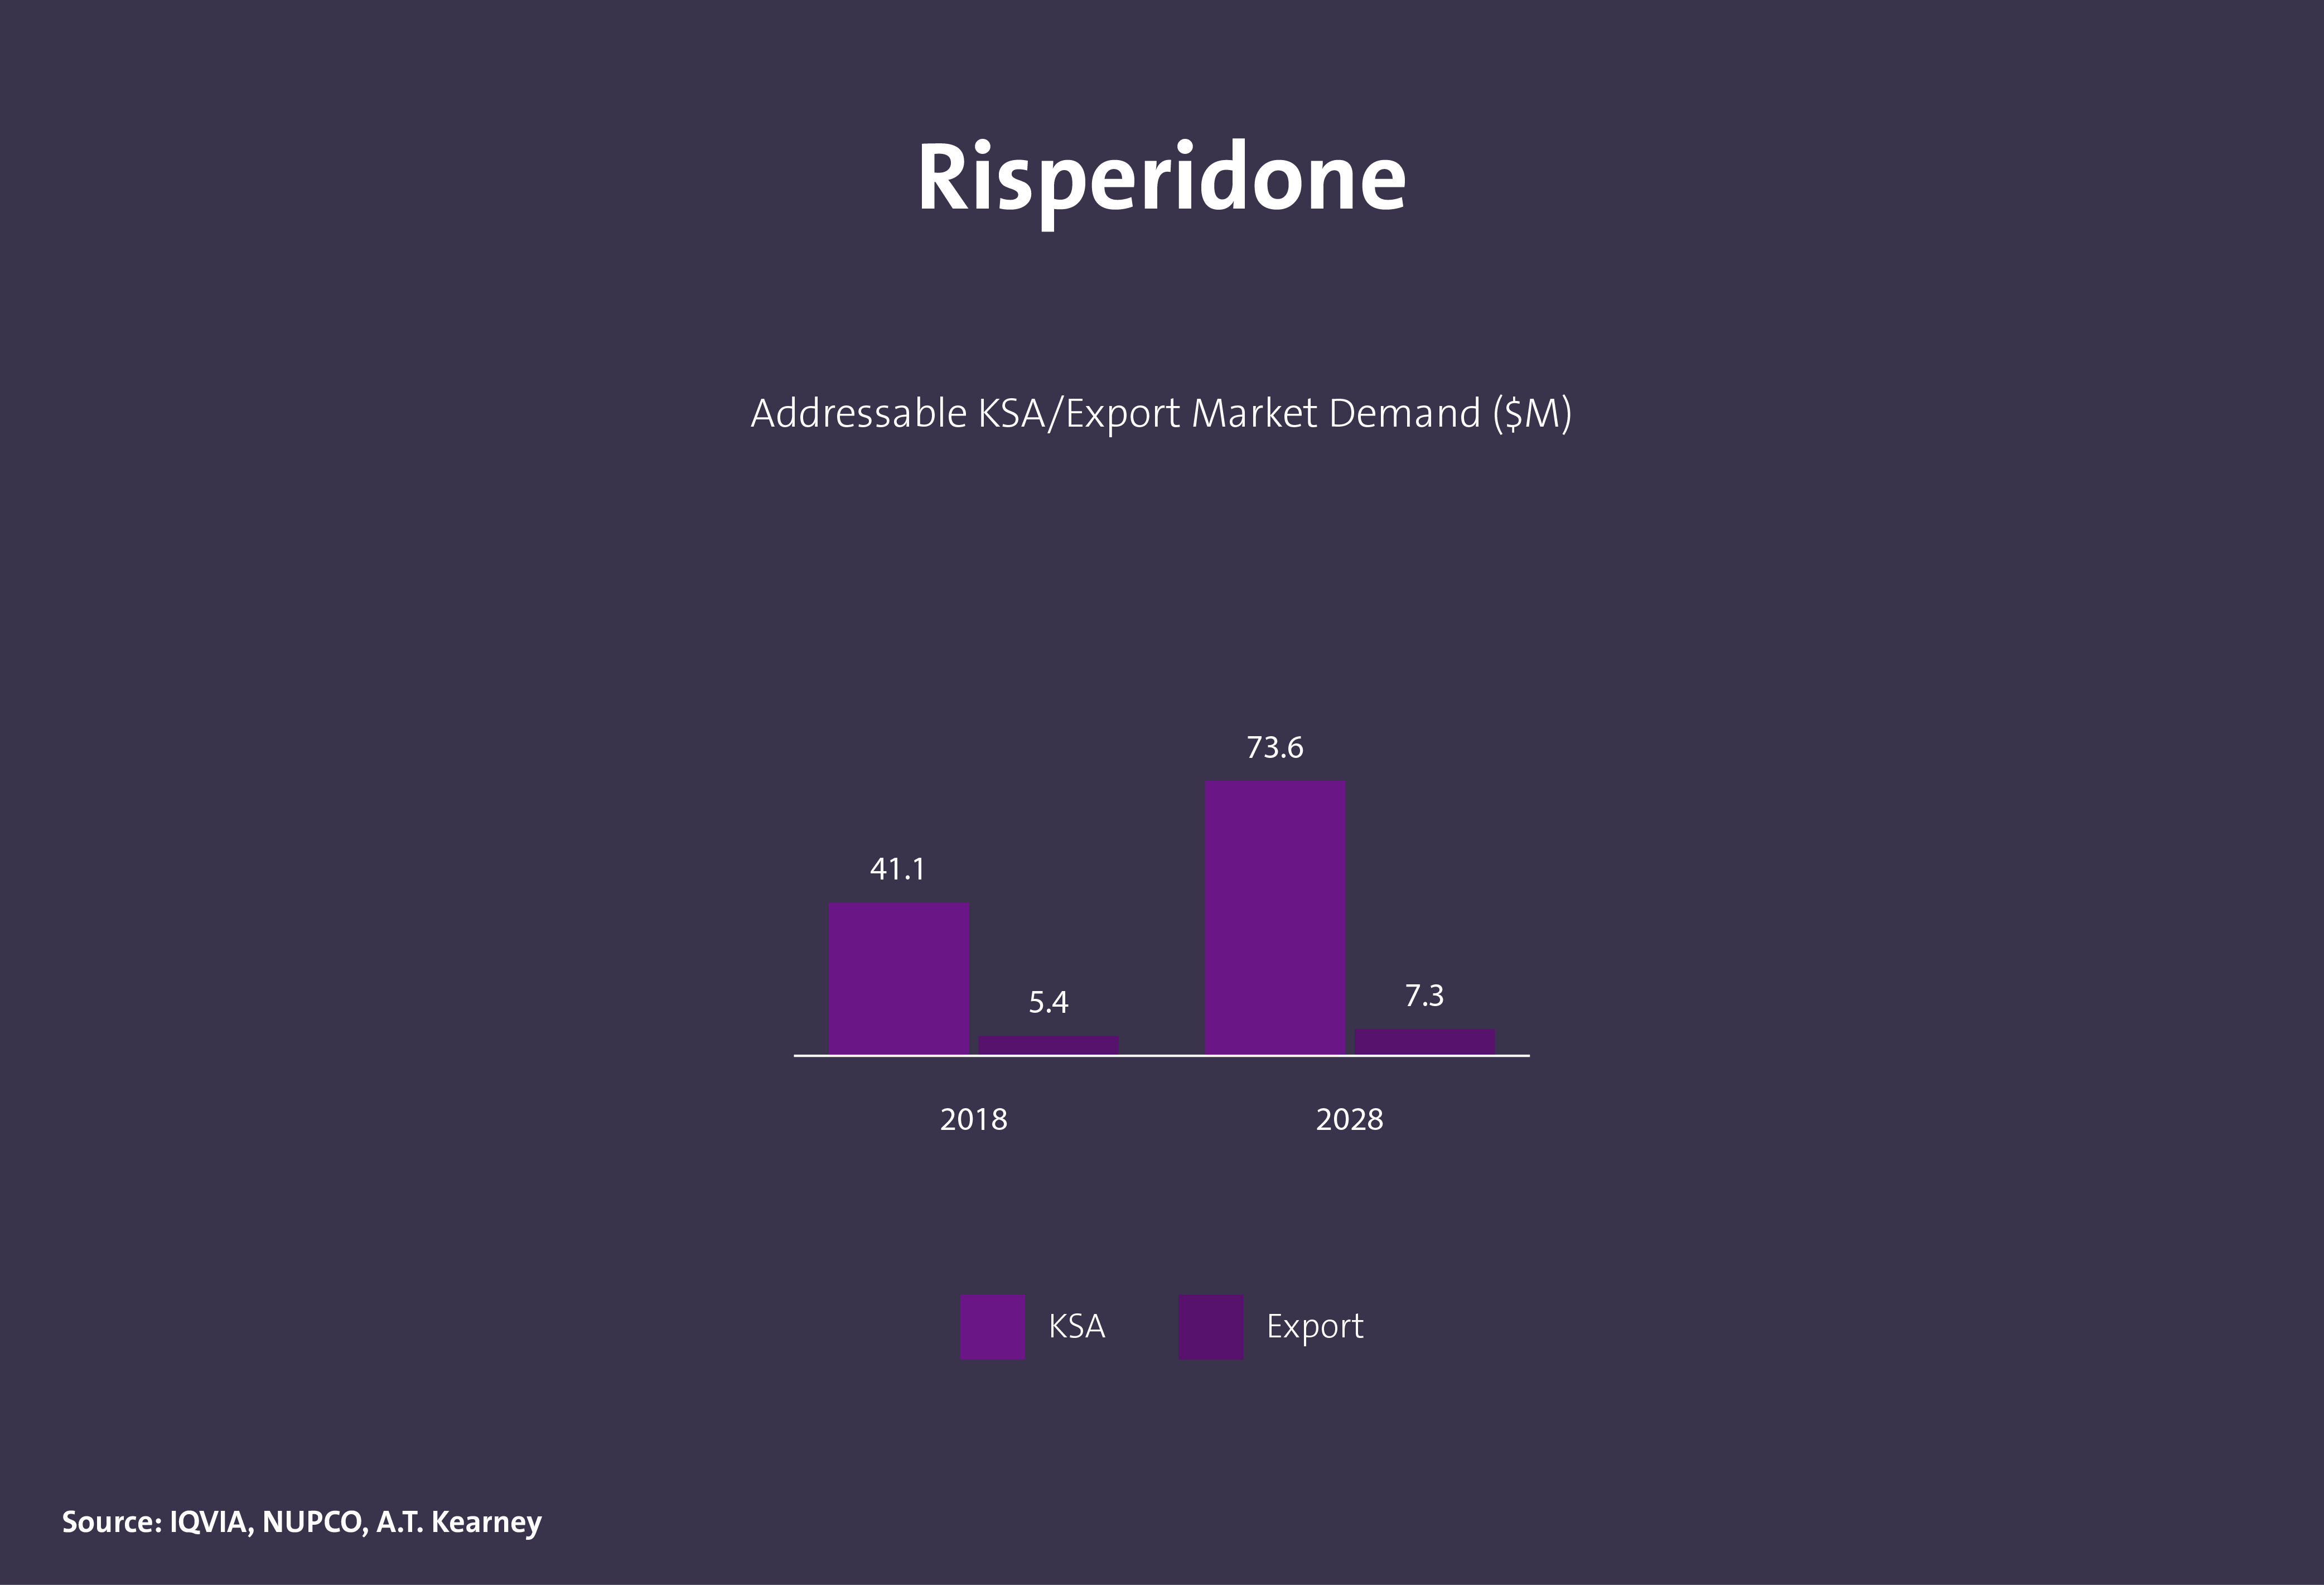
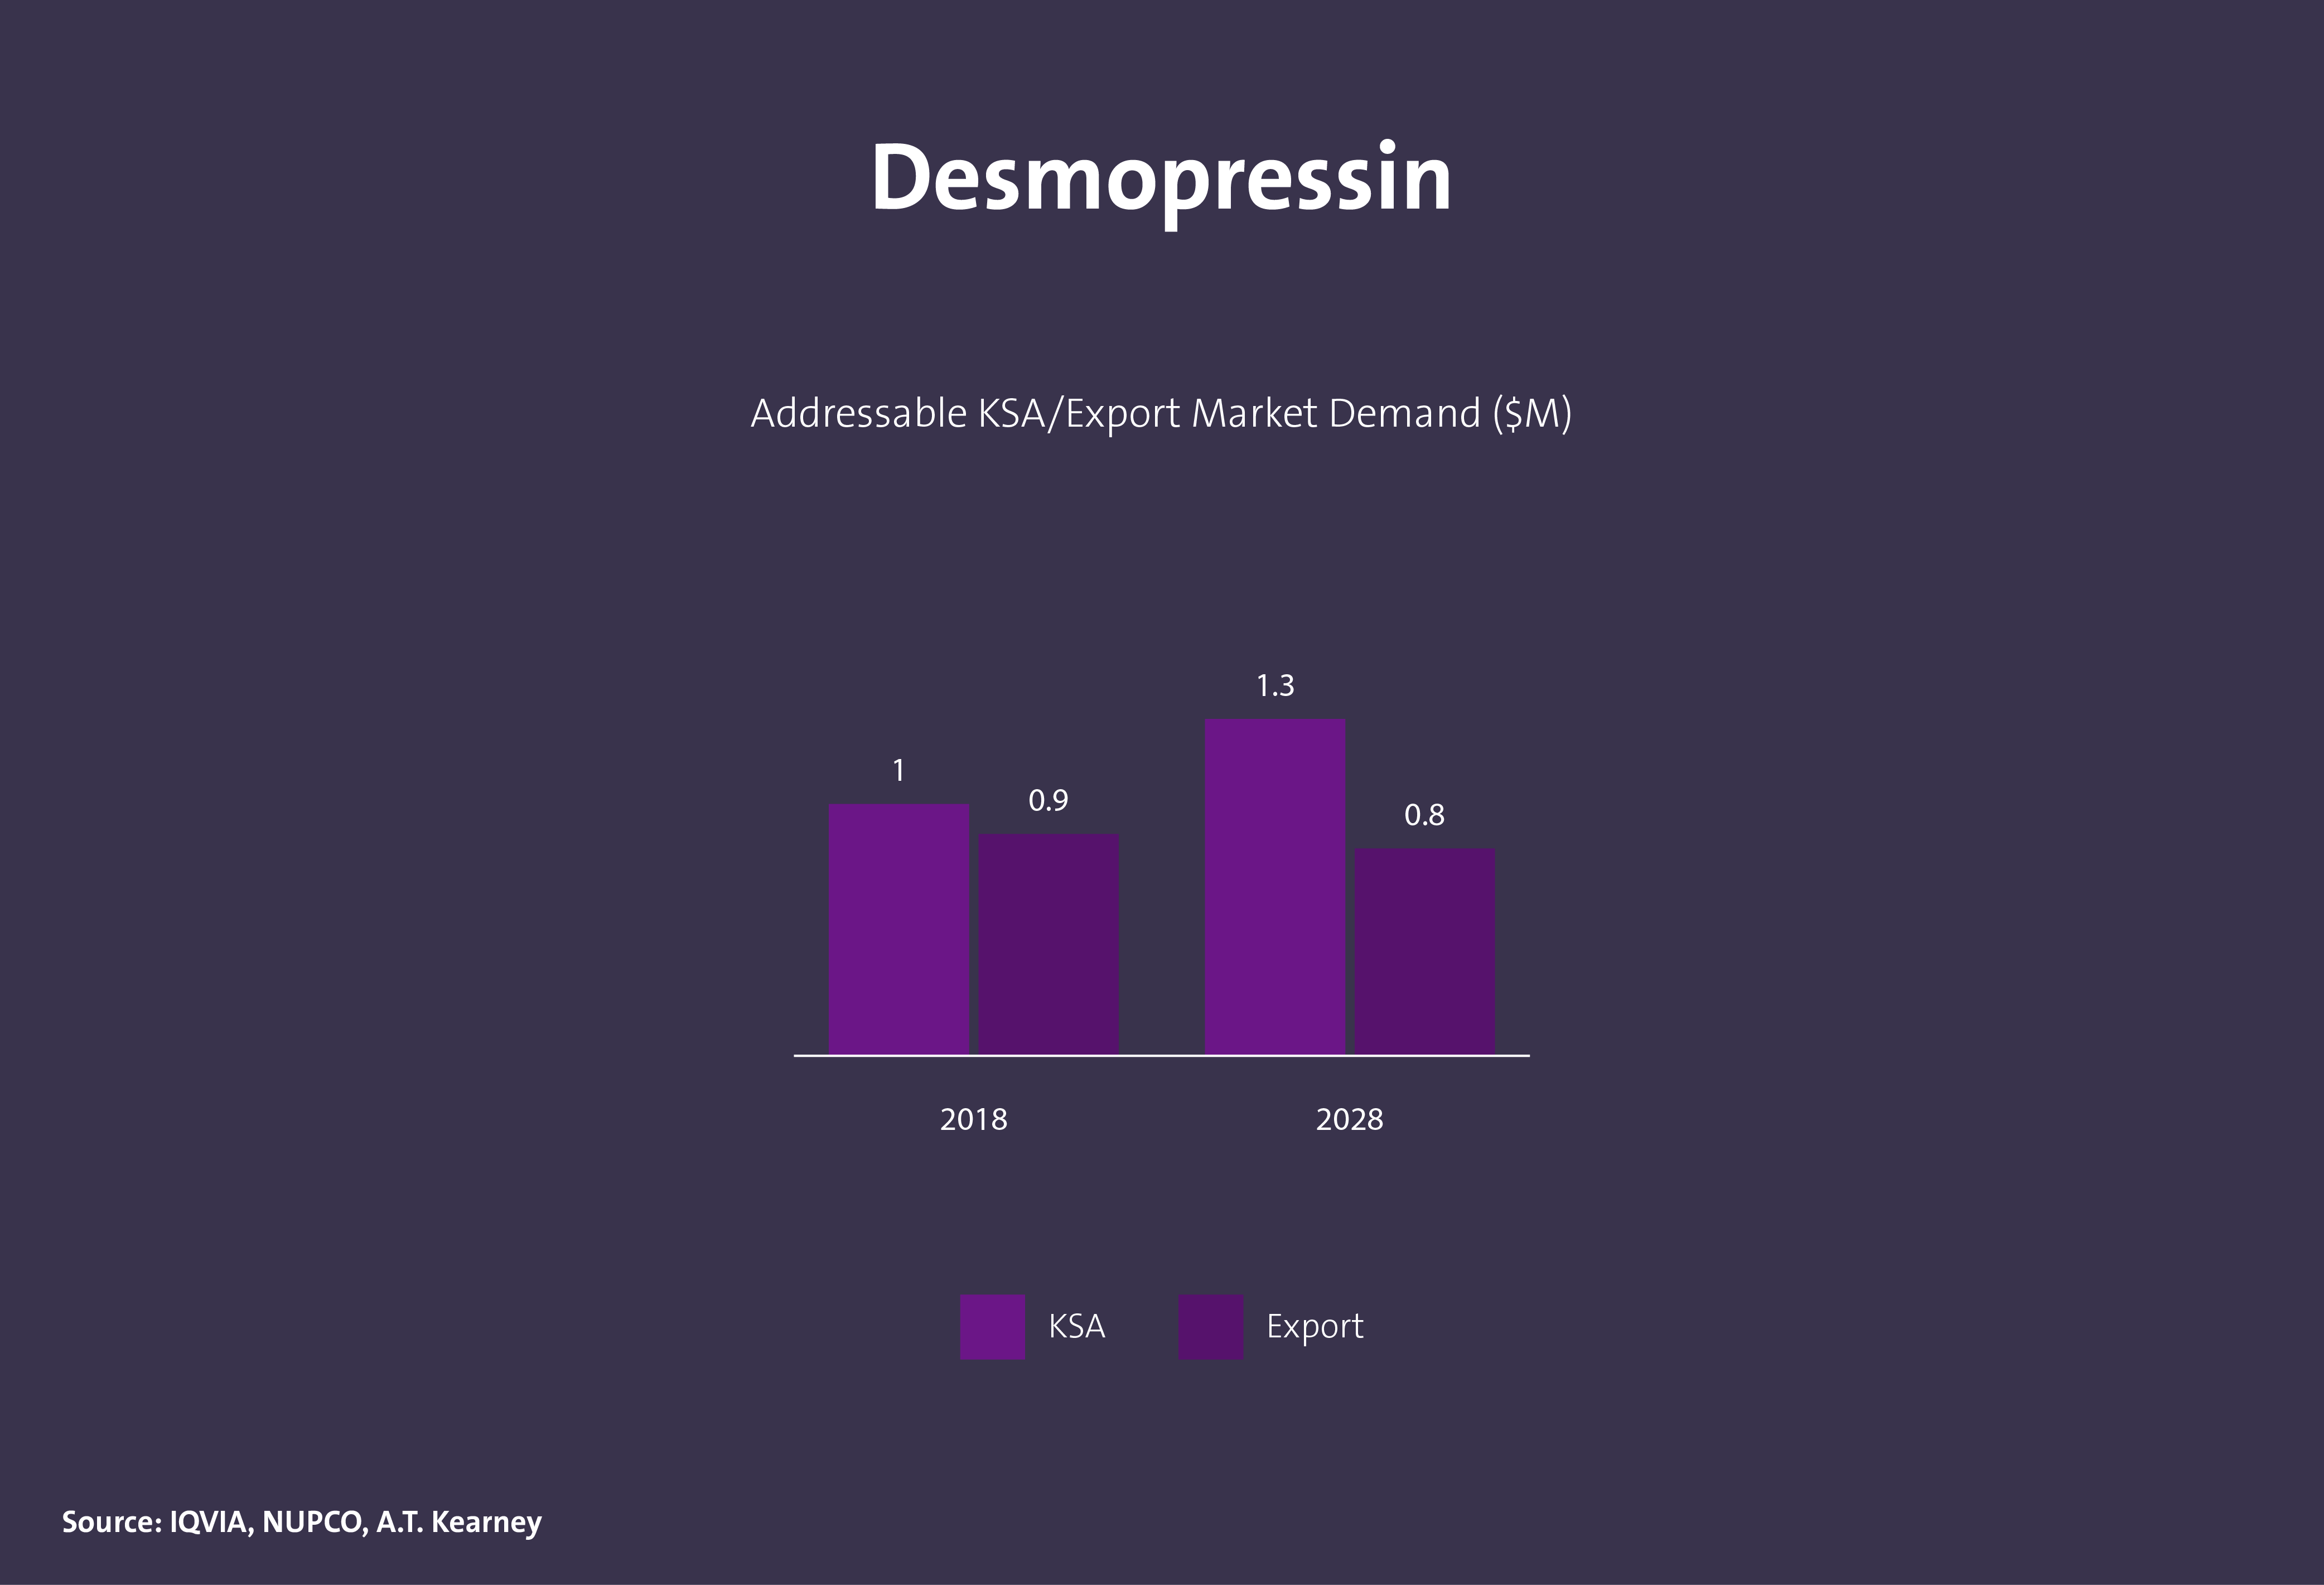
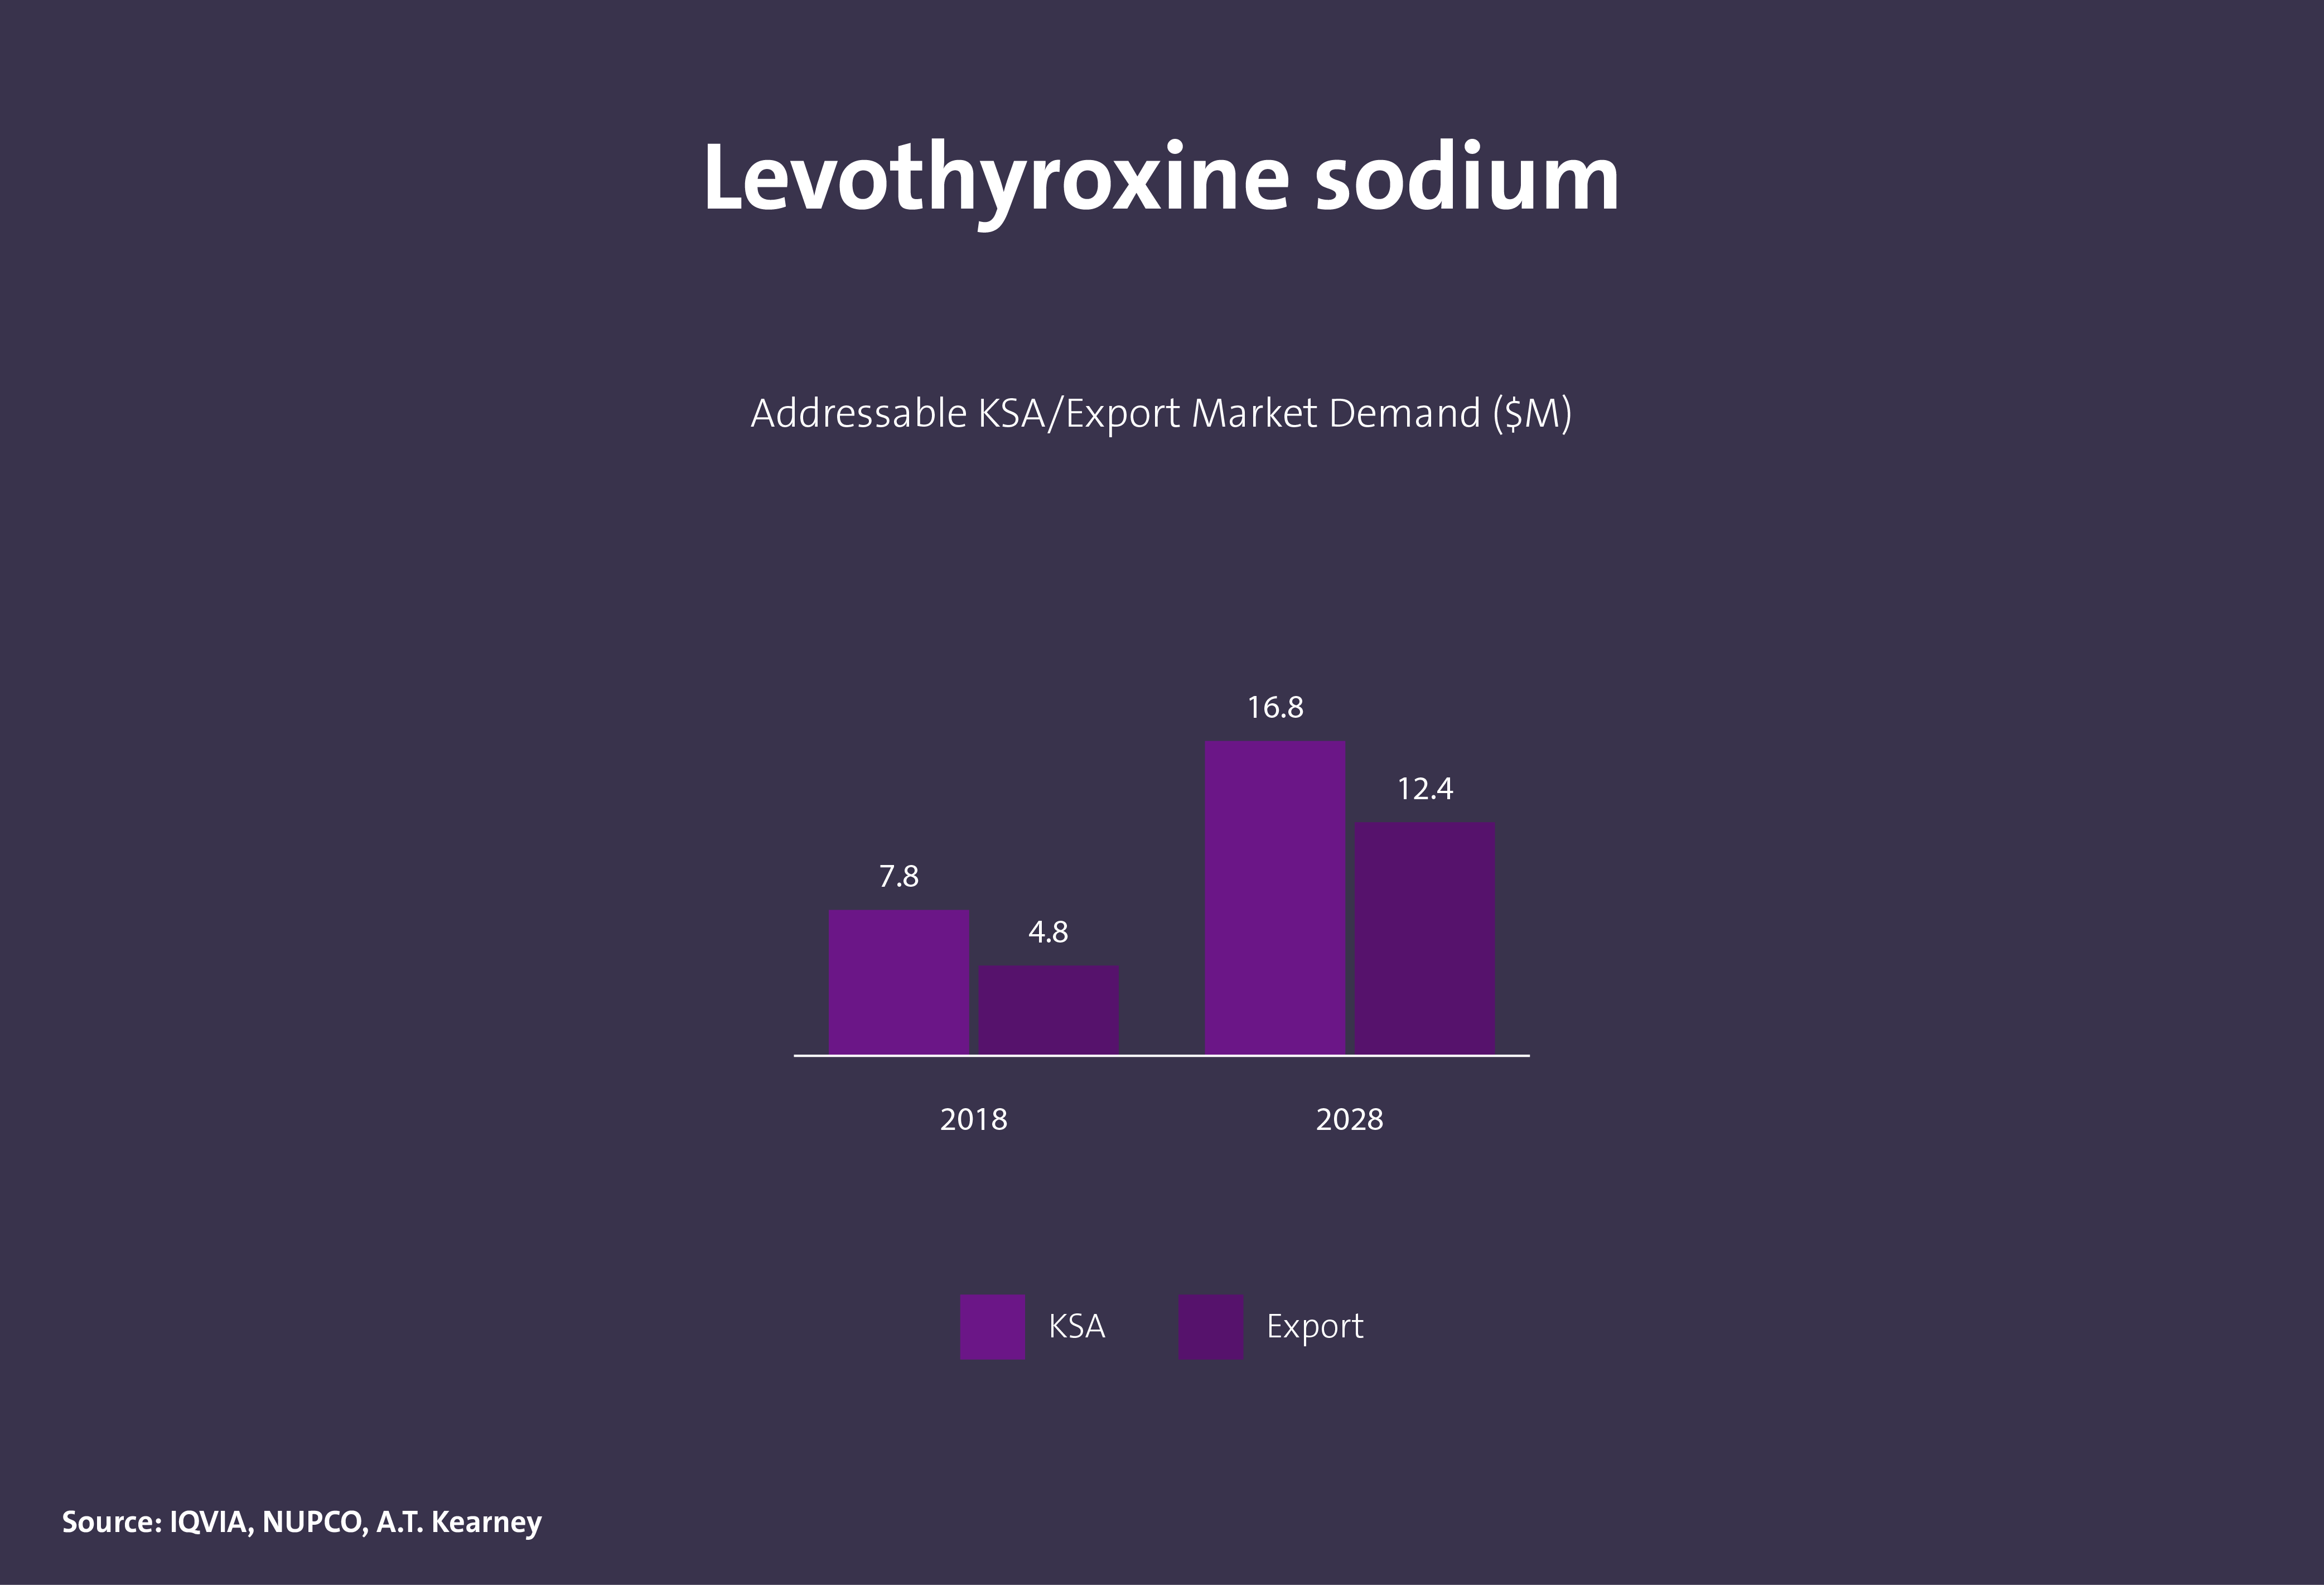


BIOLOGIC ACTIVE PHARMACEUTICAL INGREDIENT


The data and information provided through Daleel platform are for indicative purpose, the provided data and information can be assessed further and analyzed as part of the feasibility studies. In addition, following are other key sources of information that can be used for business case development.
Key Sources for Data

National Geological Database
Reliable national geological and topographic data repository for the whole kingdom of Saudi Arabia including geological and topographic maps, Mineral Occurrences Documentation System (MODS), geochemistry and geophysics data, borehole data, surface samples data and more.
Invest Saudi
For information about investment opportunities in the kingdom to both foreign and domestic investors, as well as private sector businesses please visit Invest Saudi
Tariff Rates and Data
Through the website of the Zakat, Tax and Customs Authority, you can find the tariff rates and data for all kinds of products.
Import Data
Through the website of General Authority for Statistics, you can find detailed data on Import Statistics for all kind of goods.
Export Data
Through the website of General Authority for Statistics, you can find detailed data on Export Statistics for all kind of goods.
Factories Directory
The Factories Directory is provided by the National Industrial Information Center to enable the user to inquire about factories in the Kingdom by activity, production and location, in addition to other data and information.

Ministry of Economy And Planning
A unified platform to present and analyze the latest economic and social the kingdom and its regions in visually interactive ways that facilitate understanding of the Saudi economic landscape.