MARKET INSIGHT
A deep dive look into the sectors
Select a Sector
Industry Automotive
MARKET INSIGHT
Segment Rational
RATIONAL
The Automotive industry is expected to bring significant benefits to the Kingdom as the industry represents a highly attractive regional opportunity. The light vehicles market is sizable and projected to grow at more than twice the average of the global rate during the next decade. The industry will create strong downstream pull for other priority clusters (e.g., metals, chemicals) and contribute to the Kingdom’s ambition to diversify away from oil. The kingdom is also well positioned to export to numerous nearby markets,particularly countries with no passenger vehicle manufacturer presence. Finally,developing the industry will attract a highly specialized workforce with a focus on higher value-add products (e.g., lithium-ion batteries), which will enrich the domestic pool of talent.
Segment Trends and Value Proposition
SEGMENT TRENDS

Increased connectivity in vehicles.

Massive investments in self-driving technologies.

Increasing popularity of shared mobility services.

Accelerating growth for electric vehicles.

Increased use of lightweight materials in car composition.

Moves toward Carbon-Zero agenda.
Value Proposition
•Access to critical raw material required by OEMs and suppliers.
•Size of GAFTA vehicle sales market will outpace global growth over the next decade and top 2.3 Mn units by 2030, with Saudi Arabia retaining 30% market share.
•Since women was given the right to issue a driving license by a royal decree in 2017, female drivers in KSA are expected to spur additional demand.
•KSA target to produce almost 300,000 vehicles per year by 2030.
Segment Value Chain

Global Light Vehicle Sales

• A major shift in powertrain technology is expected to take place in the next decade with BEV and HEV capturing 21% and 32% respectively of global market share.
• Europe and Greater China will be the main drivers behind electrification, mainly due to regulatory initiatives fostering xEV adoption.
• By 2030, total global sales of BEVs will top 21 Mn units and sales of HEVs will approximate 33 Mn units; ICE-only powered vehicles will be close to 47 Mn units.
Global Light Vehicle Sales by Powertrain

Key takeaways
Global powertrain electrification driven by two main factors:
1) End-market developments
•Strong development of charging infrastructure: growth in both public and private charging station.
•Decreasing battery costs: Li-Ion battery costs are expected to decrease from $140 in 2020 to close to $100 by 2023, increasing appeal of EVs relative to ICEs.
•Improving relative cost of ownership for EVs: EV TCO is low and will remain constant, while TCO for ICEs is subject to oil price swings and higher maintenance costs.
2) Regulations
•Tightening wide regulations, especially in the EU: European emission target set at 95g CO2/km in 2021.
•Country-specific initiatives: countries drive e-vehicle adoption through subsidies and other types of incentives.
•Diesel bans: 14 countries and 220 cities in Europe employ low or zero emissions zones.
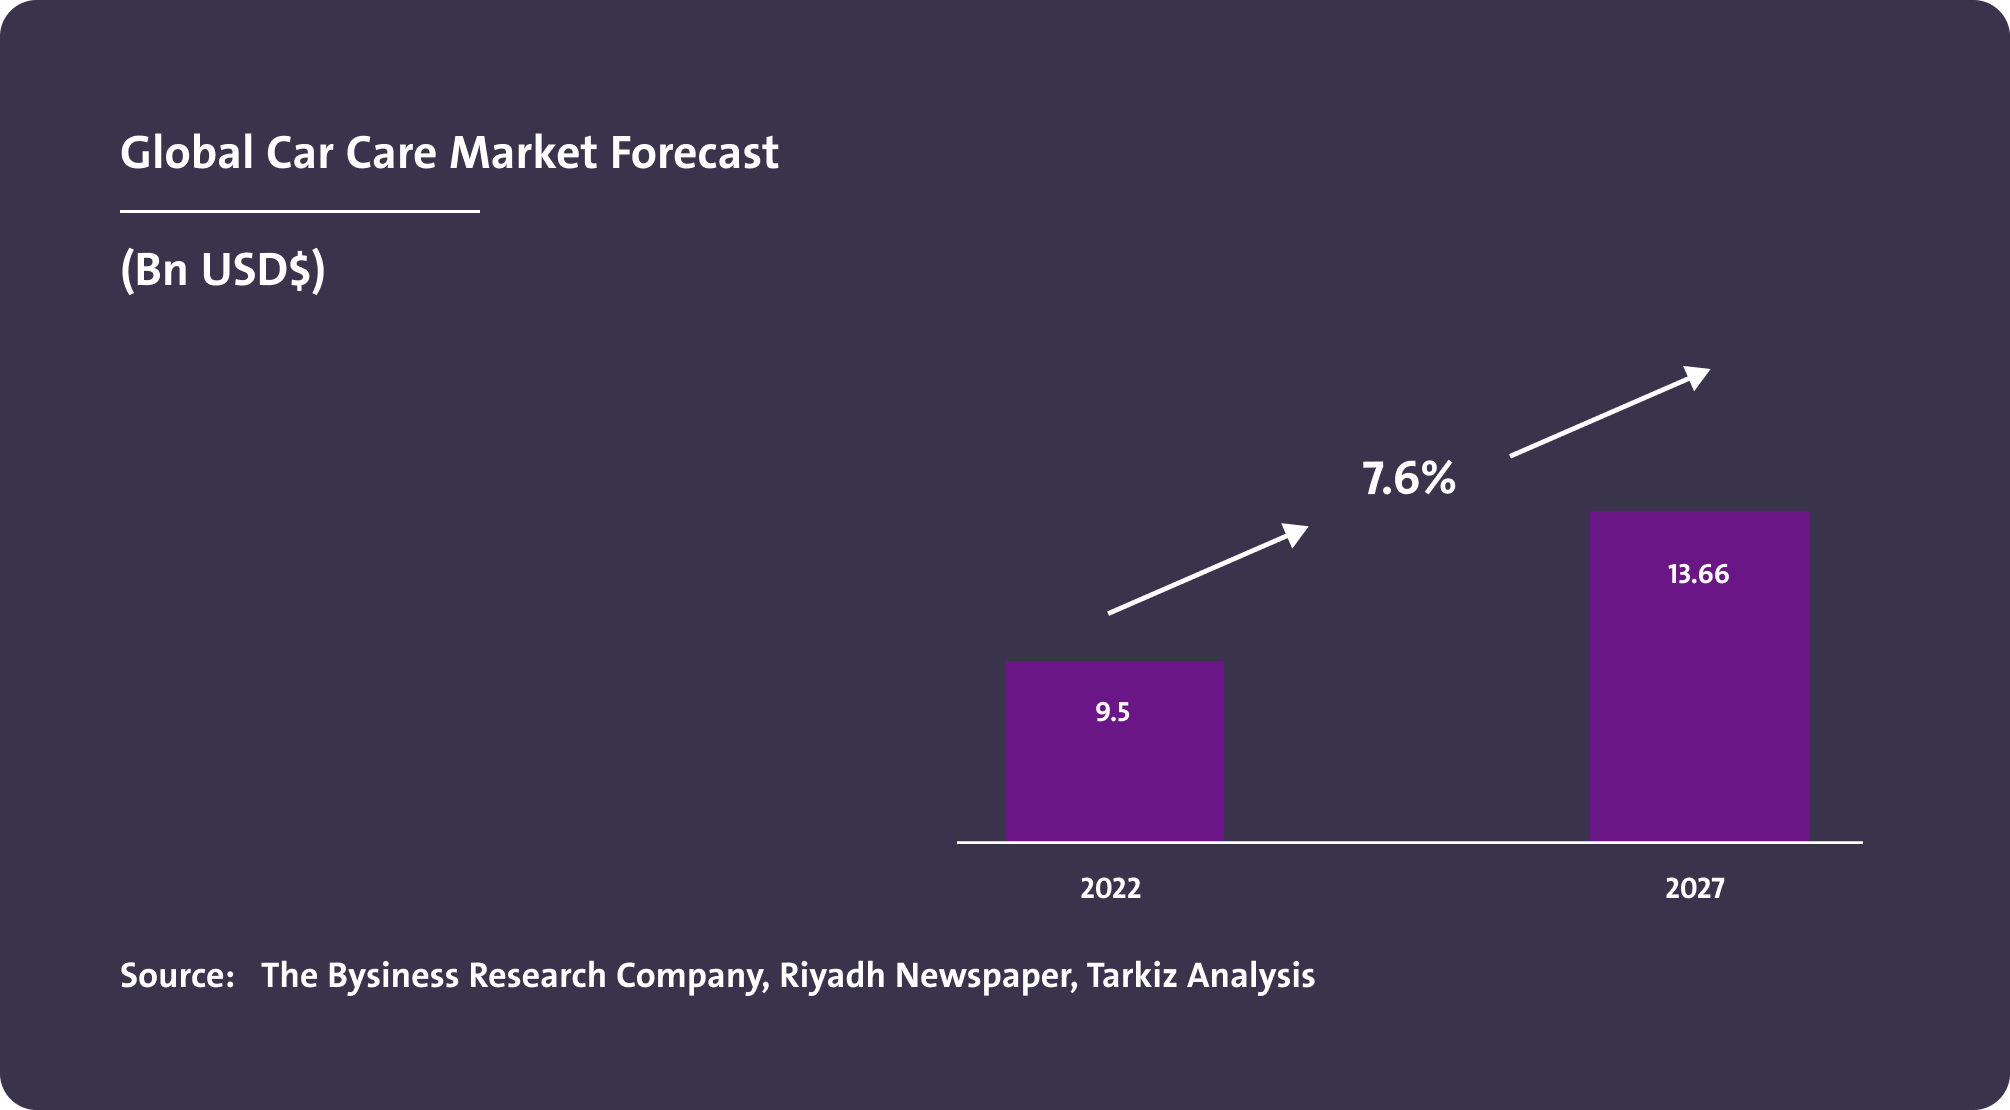
Global Car Care Market Forecast
Global Car Care Market Size

Global Polishes and Similar Preparations for Coachwork

Global Polishes For Glass and Mirrors

Global Brake Pads Imports in tons / (Million SAR)

Trade Share of Brake Pads Imported By Country

Global Brake Linings & Pads Imports (Million SAR)

Market Size for all Types of Vehicles in Tons

GAFTA/GCC Light Vehicle Sales

• Light vehicle sales in the GAFTA region are projected to increase by an average of 2.5% per year (vs. global growth of 1.2%).
• The GAFTA region is expected to grow by ~30% in the next decade and will remain dominated by Saudi Arabia and United Arab Emirates with a combined market share of ~45%.
• Alternative fuel vehicles growth will accelerate after 2025; BEVs and HEVs will grow annually by ~34% and ~33% respectively vs. ICE-only growth of 0.5%.
KSA Light Vehicle Sales

• The industry counts four commercial truck C/SKD assemblers but no passenger vehicle manufacturer or assembler.
• Some tier-2 suppliers exist producing low value items largely targeted for aftermarket and very minor tier-1 supplier presence.
• PIF made significant investments in BEVs.
• Stake in Lucid Motors plan to open local manufacturing plant to serve export market.
Middle East/Africa Light Vehicles Sales

Fastest growing region with BEV sales expected to top 360k unites and HEV sales to approach 750k unites by 2030, combining for 21% of new light vehicle volume.
KSA Light Vehicle Sales by Powertrain

Key takeaways
•KSA’s market share will remain close to 50% of total GCC sales throughout the next decade.
•Similarly to the GAFTA region, light vehicle sales of ICE-based vehicles will dominate with ~560k units sold in 2030.
•However, sales of ICE-based vehicles in 2030 will remain close to flat compared to 2019 volumes.
•Light vehicle sales of BEVs are also expected to accelerate in the Kingdom during the next decade.
KSA Medium and Heavy Commercial Vehicle Sales by Type

KSA MHCV market has been cut by more than half since 2014’s peak but is expected to bounce back in the next decade, boosted by planned major infrastructure and construction projects under the Kingdom’s vision 2030.
Local Car Care Market Size

Forecast for Local Future Car Care Demand

KSA Private Vehicles Market Size in Sets

Overview of Vehicle Classes in Saudi Arabia

The automotive market is segmented by vehicle classes; Light vehicles make up 98% of KSA’s automotive market, dominated by segments C&D.
Estimated Market Share of Brands

Distribution of Registered Vehilces in Saudi Arabia

Capacity (pieces) For Brake Pads in KSA by Manufacturer

MENA Automotive Seating Market Revenue

MENA Plastic Modules (Dashboard Panel) Market Revenue

MENA Exterior Plastic Fitting (Front and Rear Bumpers) Market Revenue

MENA Automotive Consumables Market Revenue

MENA Wipers Market Revenue

MENA Automotive HVAC Market Revenue

MENA Tires Market Revenue

MENA Automotive Instruments Market Revenue

The data and information provided through Daleel platform are for indicative purpose, the provided data and information can be assessed further and analyzed as part of the feasibility studies. In addition, following are other key sources of information that can be used for business case development.
Key Sources for Data

National Geological Database
Reliable national geological and topographic data repository for the whole kingdom of Saudi Arabia including geological and topographic maps, Mineral Occurrences Documentation System (MODS), geochemistry and geophysics data, borehole data, surface samples data and more.
Invest Saudi
For information about investment opportunities in the kingdom to both foreign and domestic investors, as well as private sector businesses please visit Invest Saudi
Tariff Rates and Data
Through the website of the Zakat, Tax and Customs Authority, you can find the tariff rates and data for all kinds of products.
Import Data
Through the website of General Authority for Statistics, you can find detailed data on Import Statistics for all kind of goods.
Export Data
Through the website of General Authority for Statistics, you can find detailed data on Export Statistics for all kind of goods.
Factories Directory
The Factories Directory is provided by the National Industrial Information Center to enable the user to inquire about factories in the Kingdom by activity, production and location, in addition to other data and information.

Ministry of Economy And Planning
A unified platform to present and analyze the latest economic and social the kingdom and its regions in visually interactive ways that facilitate understanding of the Saudi economic landscape.