MARKET INSIGHT
A deep dive look into the sectors
Select a Sector
Industry Building Materials
MARKET INSIGHT
Segment Rational
RATIONAL
The Building Materials industry has a unique opportunity to leverage KSA’s dynamism in the coming years, and thus grow its scale both domestically and regionally to bring increased economic benefit to the Kingdom. First, the large megaprojects under development mean there is significant potential in both the domestic and regional construction markets, which provide the opportunity to export to the MENA region. Second, the capabilities built by the Kingdom can make KSA a regional leader in the construction and building materials industries. Third, the integration of advanced construction methods will lead to the development of trained and skilled workers who add unique, high value to products. Finally, the Building Materials industry is imperative to shift the focus toward the circular economy and energy-efficient designs that reduce reliance on fuel.
Segment Trends and Value Proposition
SEGMENT TRENDS

Offsite construction.

Modern methods of construction.

Advanced methods of construction.

Sustainability and carbon footprint reduction.

Circular economy.

Non-metallics in construction.
Value Proposition
• The global construction market is growing, with a value of USD 4,663 bn in 2020 that is expected to reach USD 8,490 bn by 2030, growing 5% per year.
• The KSA Construction Market is growing at a CAGR of 5% (2019-2030) and is estimated to reach a value of SAR 280 bn by 2030.
• Availability of raw materials.
• Competitive access to energy resources.
Segment Value Chain

Global Construction Market by Region

• Cement is local market by nature with China as the biggest producer and exporter of , with a total capacity of ~1.8B tons and exports of ~$4B in 2019.
• Ceramic tiles is the segment with highest global demand, requiring strong design capabilities.
• Packaging glass is the segment with highest global production accounting for 45% of all global glass production.
• Stone is a globally traded market, highly fragmented in nature with a few large players.
Global Cement Production Split by Region

• With a high relative transportation cost, cement is a local market by natured exports of ~$4B in 2019.
• The industry is characterized by national and multi-national consolidation in search for economies of scale.
• Global trend towards energy efficiency and CO2 reduction has led manufacturers to diversify fuel mix, reduce clinker factor and minimize plant energy consumption.
Global Ceramics Demand Split by Region

Ceramic tiles:
• Wall and floor tiles is the segment with highest global demand.
Sanitary ware:
• The sanitary ware market is mostly brand-driven.
• Leading market players have been investing in Industry 4.0 applications to automate the manufacturing process for sanitary ware.
Clay pipes:
• The clay pipes market is typically local in nature due to high transportation costs and ease of production.
Global Stone Market Size Split by Region

• Stone is a globally traded market, highly fragmented in nature with a few large players.
• Usage of stone is mainly defined by architects and designers, making it subject to competition with other building materials (e.g., ceramics).
• China is both the top importer (~$2.5B in 2019) and exporter (~$ 2.4B in 2019) of stone globally.
• Stone-manufacturing companies have been investing in industry 4.0 technologies to adopt automation for energy-efficiency purposes.
Top 5 Glass Producing Countries

Float glass:
• The float glass market is a regional one, mainly due to high transportation costs.
Packaging glass:
• Packaging glass is the segment with highest global production accounting for 45% of all global glass production.
Glass fibers:
• The competitive landscape for glass fibers is highly concentrated (top 5 players account for ~69% of production).
•Quality, cost, innovation and speed of delivery are major competitiveness factors.
Top 5 Construction Markets in the MENA Region

• Turkey is the top exporter of cement, 83% of which is clinker and powder cement, with USA as a significant market (17% of total).
• Turkey is leader in ceramic design education with courses given in over 54 different faculties and schools across the country.
• Packaging glass is the segment with highest regional production, and makes up majority of exports.
• Turkey is the top of exporter of Marble (~$1.78B), whereas the UAE is the top export- er of Limestone (~$247M).
Estimates of Historical and Future Demand for the Cement Based Finishing Materials in The Local Market/Export Market

Most Prominent Countries Importing the Cement Product in 2021 Globally (Thousand Dollars)

Most Important Exporting Countries for the Cement Product Globally in 2021 (Thousand Dollars)

Most Important Export Companies of Plastic Tiles for 2021 (Thousand Dollars)

Global Volume of Exports of Plastic Tiles for 2021 (Tons)

Most Important Import Companies of Plastic Tiles for 2021 (Thousand Dollars)

Global Volume of Exports of Plastic Tiles for 2021 (Tons)

Top 5 MENA Cement Importers
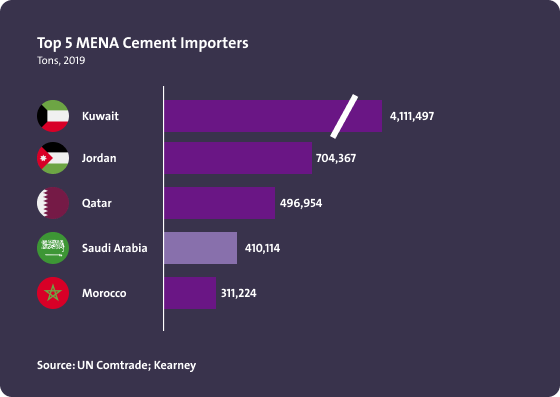
• Kuwait is the top importer of cement (of which 34% is clinker and 38% is powder cement).
• 13% of Kuwait imports originate from KSA.
• 90% of Jordan imports originate from KSA.
Top 5 MENA Cement Exporters
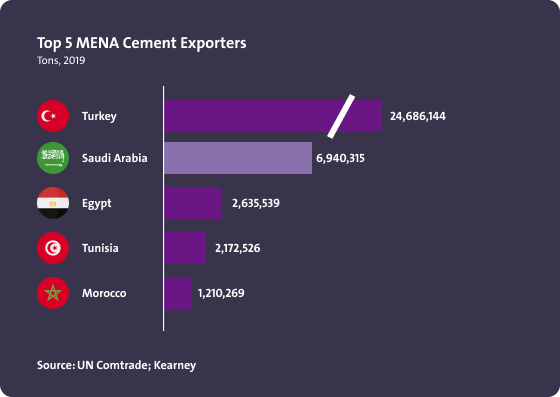
• Turkey is the top exporter of cement (50% of which is clinker), with the United States as main export market.
• The majority of KSA exports in cement consist of clinker.
Top 5 MENA Ceramics Importers
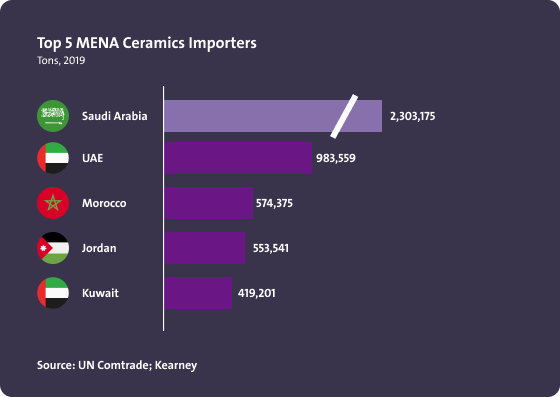
• KSA is the top importer of ceramics (67% of which is floor tiles).
• India, China and Spain are major sources of import regionally.
Top 5 MENA Ceramics Exporters
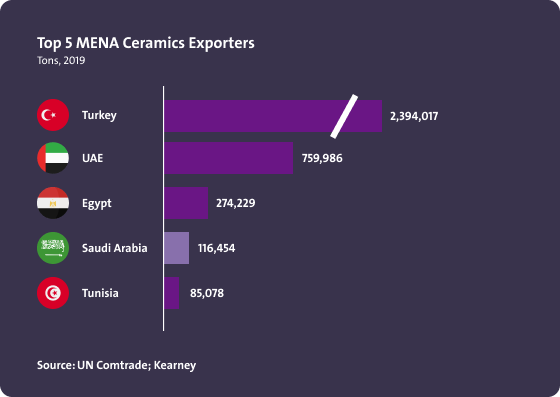
Turkey is the top regional exporter of ceramics (62% of which is floor tiles), with Germany, USA and the UK as main export markets.
Top 5 MENA Glass Importers
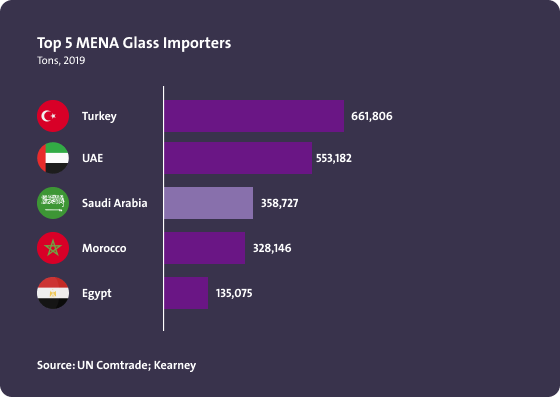
• Turkey is the top importer of glass, 31% of which is glass fibers (including glass wool).
• China is the top source of imports across the top 5 regional countries.
Top 5 MENA Glass Exporters
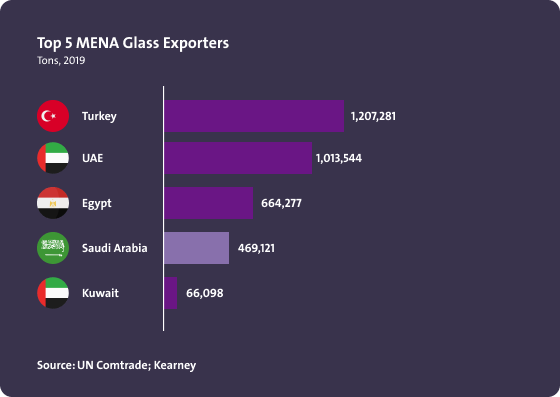
• Turkey is the top exporter of glass (of which 28% is packaging glass, and 19% tempered/laminated glass).
• For KSA, packaging glass consists of 20% of all exports.
Top 5 MENA Stone Importers
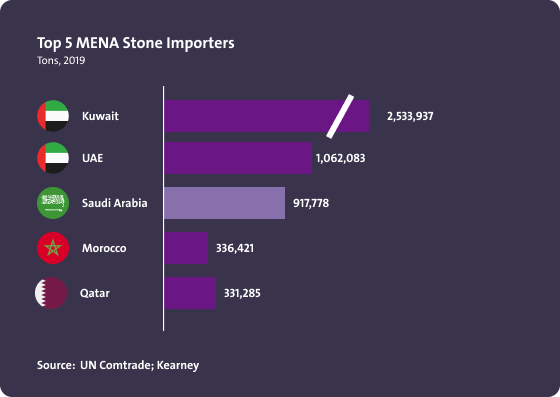
• Kuwait is the top importer of stone.
• 90% of imports in KSA consist of Marble.
Top 5 MENA Stone Exporters
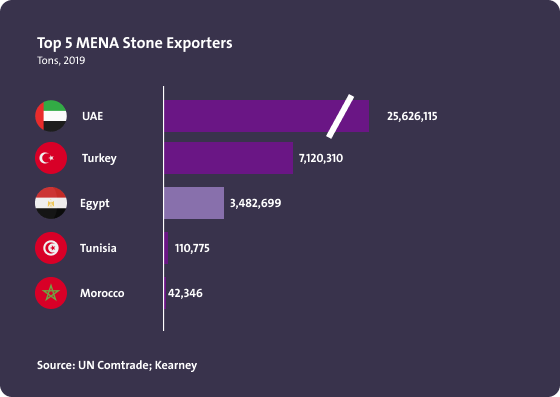
• The UAE is the top exporter of stone, of which 85% is Limestone.
• The Kingdom has very minimal exports of stone.
Regional Importing Value of the Cement Product 2017 - 2021 (Per Thousand Dollars)

Development of the Value of Saudi Imports of the Cement Product in the Period 2017-2021 (Thousand Dollars)

Value of Global Imports of Plastic Tiles for 2021 (Thousand Dollars)

KSA Construction Market Value

• The cluster builds on the sizeable KSA construction market that is expected to return to a growth path, with multiple mega projects in the pipeline.
Number of Building Permits Issued in Saudi Arabia

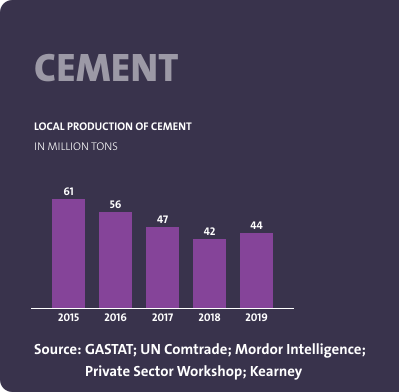
Local Production of Cement
The Quantity of Imports and Local Production for the Cement Product per Tons

The Expected Gap in the Cement Product during the period (2021 -2026)

Value of Saudi Imports of Plastic Tiles for 2021 (Tons)

Quantity of Re-Exported Plastic Tiles to abroad (Tons)

Quantity of Local Production for Plastic Tiles (Tons)

Expected Gap in Plastic Tiles in KSA (Tons)

Trade Balance of Cement

KSA Modular Concrete Market Size

Production VS. Consumption of Ceramic Tiles

Trade Balance of Sanitary Ware

KSA Float Glass Market Size

Trade Balance of Packaging Glass

Trade Balance of Granite

The data and information provided through Daleel platform are for indicative purpose, the provided data and information can be assessed further and analyzed as part of the feasibility studies. In addition, following are other key sources of information that can be used for business case development.
Key Sources for Data

National Geological Database
Reliable national geological and topographic data repository for the whole kingdom of Saudi Arabia including geological and topographic maps, Mineral Occurrences Documentation System (MODS), geochemistry and geophysics data, borehole data, surface samples data and more.
Invest Saudi
For information about investment opportunities in the kingdom to both foreign and domestic investors, as well as private sector businesses please visit Invest Saudi
Tariff Rates and Data
Through the website of the Zakat, Tax and Customs Authority, you can find the tariff rates and data for all kinds of products.
Import Data
Through the website of General Authority for Statistics, you can find detailed data on Import Statistics for all kind of goods.
Export Data
Through the website of General Authority for Statistics, you can find detailed data on Export Statistics for all kind of goods.
Factories Directory
The Factories Directory is provided by the National Industrial Information Center to enable the user to inquire about factories in the Kingdom by activity, production and location, in addition to other data and information.

Ministry of Economy And Planning
A unified platform to present and analyze the latest economic and social the kingdom and its regions in visually interactive ways that facilitate understanding of the Saudi economic landscape.