MARKET INSIGHT
A deep dive look into the sectors
Select a Sector
Industry Mining Downstream – Steel
MARKET INSIGHT
Segment Rational
RATIONAL
Steel industry is vital to enabling downstream development of other sectors (e.g., construction, automotive, renewables, aerospace) by providing critical raw materials and stimulating the manufacturing industry. Today, close to 75% of KSA’s Steel production capacity focuses on Rebar and Wire Rod, which are heavily used in construction, while products like Plates, Tinplate, and Round Billets are imported. Both the domestic and regional Steel markets have significant growth potential across many product segments.
Segment Trends and Value Proposition
SEGMENT TRENDS

Decarbonization

Energy reforms.

Digitalization.

Global overcapacity in Steel.
Value Proposition
• Globally, crude Steel consumption reached 1,880 million metric tons in 2020, Global consumption is projected to increase 1.7% annually over the next decade. Both the domestic and regional Steel markets have significant growth potential across many product segments.
• Capitalizing on the Kingdom mineral resources and its position as the largest GCC market.
• Vast natural gas availability and low electricity prices.
Segment Value Chain

Global Crude Steel Consumption by Region

• Global Crude Steel consumption projected to increase by ~2% over next decade and will remain heavily dominated by China.
• Capacity increases have outweighed closures, creating global excess which has led to depressed utilization rates, imperiling the long-term economic viability and efficiency of the industry.
•Majority of exports originate from Asia (largely from China) while imports are vastly destined for Europe and North America.
Top 5 Global Importers of Semi-Finished and Finished Steel Products
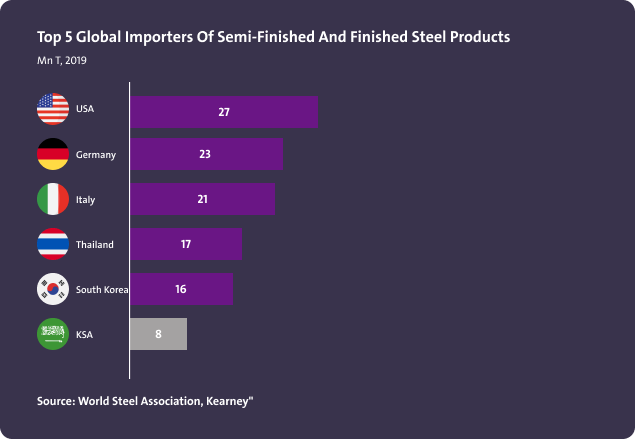
• USA is the biggest importer of steel products, led by flat products, with the majority coming from Canada, Brazil and Mexico.
• When combined, European Union members imported 40.2 Mn t in 2019, excluding intra-regional trade.
Top 5 Global Exporters of Semi-Finished and Finished Steel Products
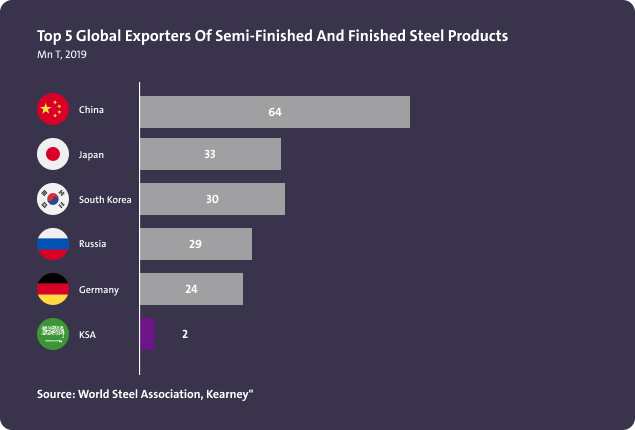
China, with more than 50% of global production, is by far the largest exporter of steel products. The top 3 exporters (China, Japan and South Korea) represented 30% of global exported volumes in 2019.
Regional Steel Production Capacities by Country
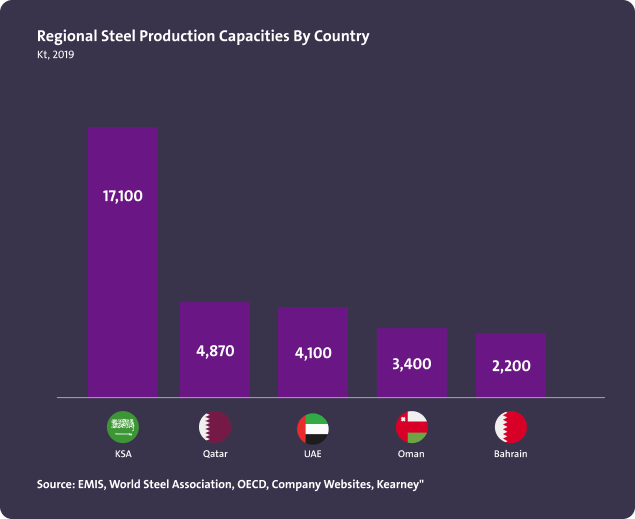
• Saudi Arabia has by far the highest capacity in the GCC region (incl. steel-making and downstream finished products). No upstream capabilities exist in the region, thereby obligating all countries to import DR grade iron ore pellets to serve as feed- stock for their Electric Arc Furnaces (EAFs). The region is experiencing structural overcapacity in rebars and wire rods with close to 60% of the total capacity concentrated in these two product segments.
GCC Main Steel Sector Producers Capacities (1/2)

A wide range of midstream and downstream products can be found manufactured in the region.
GCC Main Steel Sector Producers Capacities (2/2)
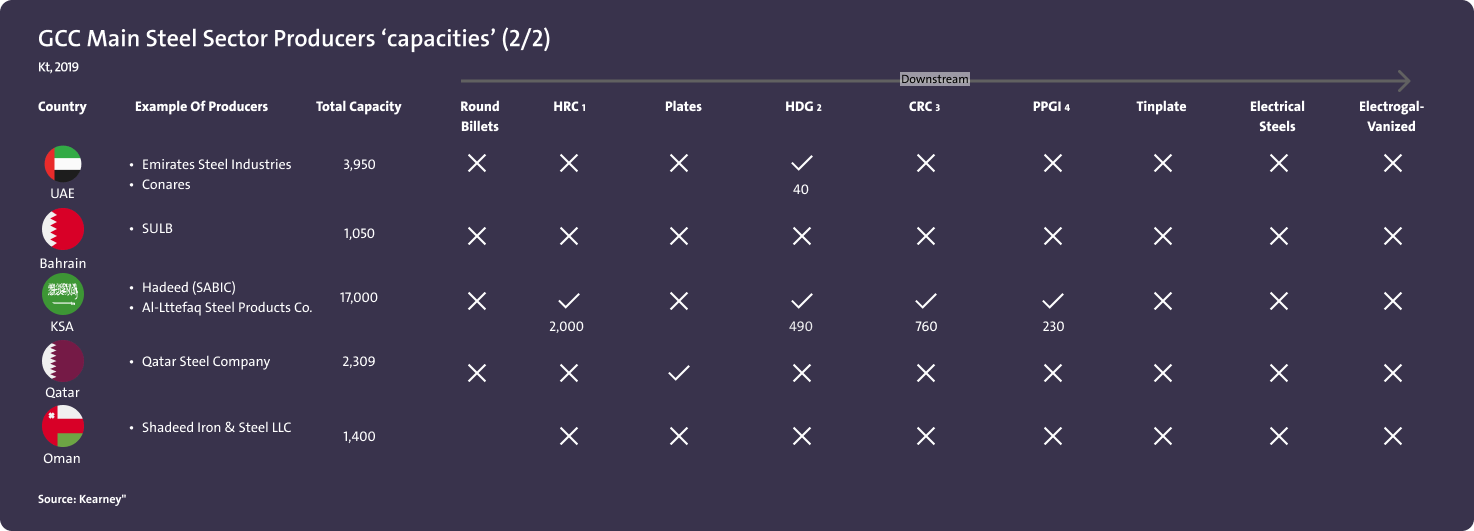
A wide range of midstream and downstream products can be found manufactured in the region.
KSA Raw Materials Mix

With no domestic iron ore production, KSA is required to import large quantities of DR grade iron ore pellets and scrap from various players to feed its EAFs.
KSA Finished Steel Consumption by Products

KSA Finished Steel Capacities

• Close to 60% of KSA’s finished steel capacity is concentrated in rebars, of which 2.8 Mn t comes from induction furnaces.
• Wire rods are produced by 4 players: Hadeed, Al Ittefaq Steel, Rajhi Steel, and Solb Steel.
• Sections are manufactured by 4 producers led by United Sulb which accounts for most of the capacity.
• Hadeed is the only producer of flat products in the Kingdom.
•Only 2 seamless tubes producers in KSA: JESCO and ArcelorMittal .
KSA Finished Steel Consumption By Industry

lose to 75% of KSA’s steel is consumed by the construction sector which utilizes most of the rebar and wire rod. Oil & Gas sector is the second largest consumer and the main user of seamless tubes.
KSA Finished Steel Capacity by Product

• 80% of KSA’s capacity is in long products which are in overcapacity.
•Rebars has close to 100% overcapacity.
•Wire Rods has more than 50% overcapacity.
KSA Steel Imports by Product

• Overall, imports dropped close to 40% since 2014.
• Imports of long products have declined significantly due to the added capacity in the Kingdom.
• However, imports of flat products have only seen a minor decrease and remain elevated due to the minimal capacity in KSA, particularly in HRC, plates and tinplate.
Iron Ore Price Evolution

In fact, prices for both iron ore and steel scrap have soared over the last 5 years, more recently pushed higher by surging steel demand post COVID-19.
Steel Scrap Price Evolution

In fact, prices for both iron ore and steel scrap have soared over the last 5 years, more recently pushed higher by surging steel demand post COVID-19.
Demand and Capacity of Round Billets in KSA

Demand and Capacity of Steel Plates in KSA

Demand and Capacity of Hot Rolled Coil (HRC) in KSA

The data and information provided through Daleel platform are for indicative purpose, the provided data and information can be assessed further and analyzed as part of the feasibility studies. In addition, following are other key sources of information that can be used for business case development.
Key Sources for Data

National Geological Database
Reliable national geological and topographic data repository for the whole kingdom of Saudi Arabia including geological and topographic maps, Mineral Occurrences Documentation System (MODS), geochemistry and geophysics data, borehole data, surface samples data and more.
Invest Saudi
For information about investment opportunities in the kingdom to both foreign and domestic investors, as well as private sector businesses please visit Invest Saudi
Tariff Rates and Data
Through the website of the Zakat, Tax and Customs Authority, you can find the tariff rates and data for all kinds of products.
Import Data
Through the website of General Authority for Statistics, you can find detailed data on Import Statistics for all kind of goods.
Export Data
Through the website of General Authority for Statistics, you can find detailed data on Export Statistics for all kind of goods.
Factories Directory
The Factories Directory is provided by the National Industrial Information Center to enable the user to inquire about factories in the Kingdom by activity, production and location, in addition to other data and information.

Ministry of Economy And Planning
A unified platform to present and analyze the latest economic and social the kingdom and its regions in visually interactive ways that facilitate understanding of the Saudi economic landscape.