MARKET INSIGHT
A deep dive look into the sectors
Select a Sector
Industry Food & Beverage Processing
MARKET INSIGHT
Segment Rational
RATIONAL
There is a large Regional and Global Market opportunity, and KSA has Significant potential in both the domestic and regional food-and-beverage(F&B) markets, with expected growth across all product segments. It is also a pivotal cluster for National resiliience; Building on The COVID-19 Pandemic, this cluster will play a key role in achieving National food Supply Chain Resilience. Strong Potential for integration to secondary Processing exists due to the presence of strong Conglomerates and Private Sector companies with Expandable capabilities in key Segments (e.g., dairy, seafood). Finally, there is increasing Integration of Tech Know-How and skills in this Cluster that is Developing trained, skilled workers who add unique high value to products.
Segment Trends and Value Proposition
SEGMENT TRENDS

Growing focus on national resilience and food security.

Rapid development of agriculture technologies.

Increased investment in cultured meat.

Integration across the value chain.

Increased demand for organic, healthy and innovative products.
Value Proposition
• The global F&B market was valued at USD 6.27 trillion in 2019 and is expected to grow at a CAGR of 6% until 2030, when it reach USD 12 trillion.
• KSA’s F&B market is expected to grow from SAR 154 billion in 2019 to SAR 214 billion in 2030, a 3% CAGR.
• Abundance of fish and dates in the Kingdom.
• Planned Establishment of food parks connecting farmers, processors, packagers and retailers with shared infrastructure and utilities.
• Demand for Halal meat from Islamic countries provide strong export opportunities.
• The food processing sector will grow the Kingdom’s GDP from SAR 46 billion in 2021 to almost double in 2030, reaching to SAR 83.2 billion.
Segment Value Chain

KSA Food and Beverage Market Size

KSA’s F&B market had been stable over the last three years, but is expected to grow steadily across all product segments until 2030.
Top 5 MENA Meat and Poultry Importers
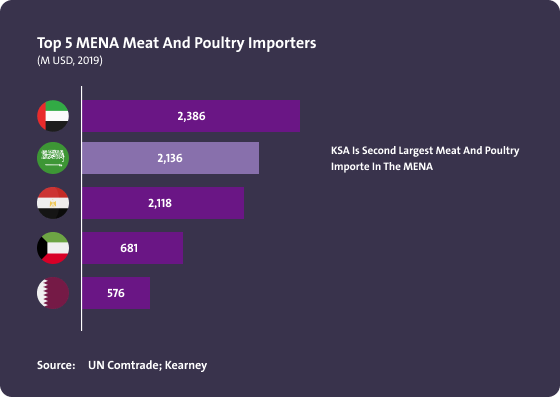
• The UAE is the largest importer of meat and poultry in the region.
• KSA is second largest importer of meat and poultry in the region.
Top 5 MENA Meat and Poultry Exporters
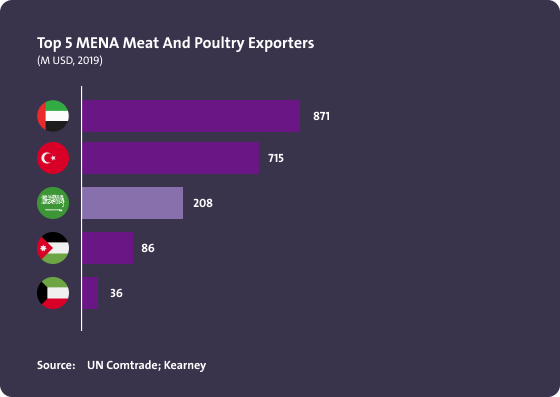
MENA countries typically export minimal quantities of meat and poultry.
Top 5 MENA Dairy Importers
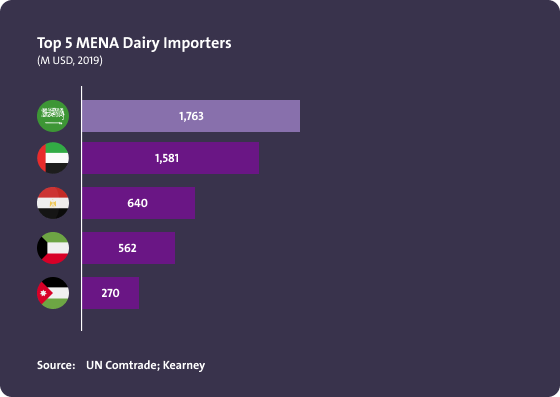
Although KSA is the largest importer of dairy, it constitutes a major share of the imports of Kuwait and Jordan.
Top 5 MENA Dairy Exporters
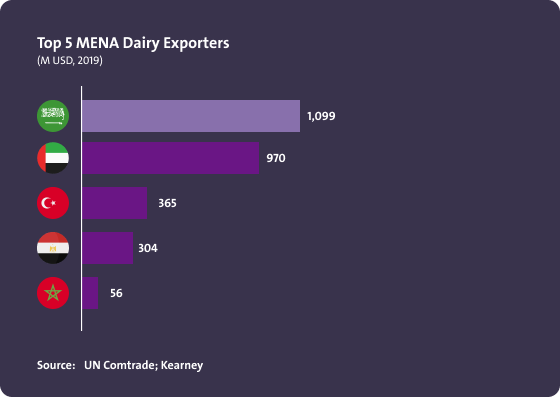
• KSA is the largest exporter to dairy.
• KSA is both the top importer and exporter of dairy.
• The UAE is a significant export market for KSA.
Top 5 MENA Seafood Importers
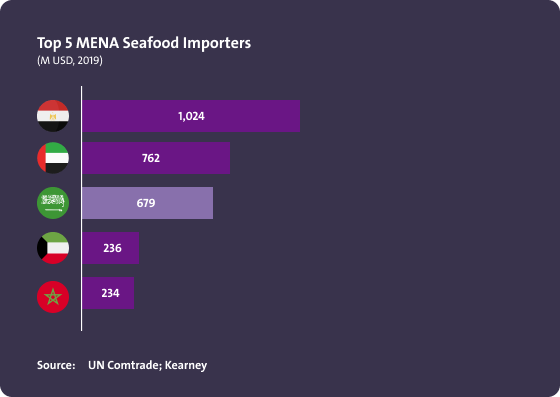
Egypt is the top importer of seafood in the region.
Top 5 MENA Seafood Exporters
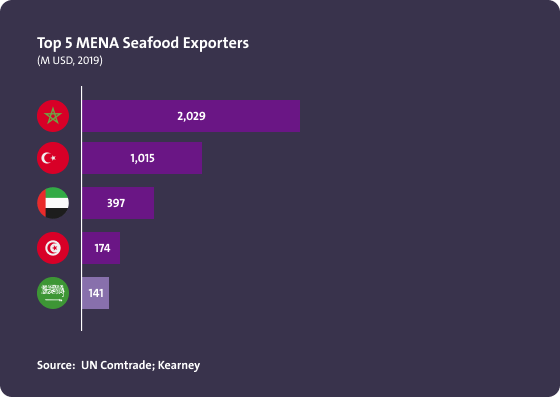
• Morocco dominates the seafood export market in the MENA.
• KSA faces fierce competition in the seafood export market.
• China a is key target market for KSA.
Top 5 MENA Animal and Vegetable Oils Importers
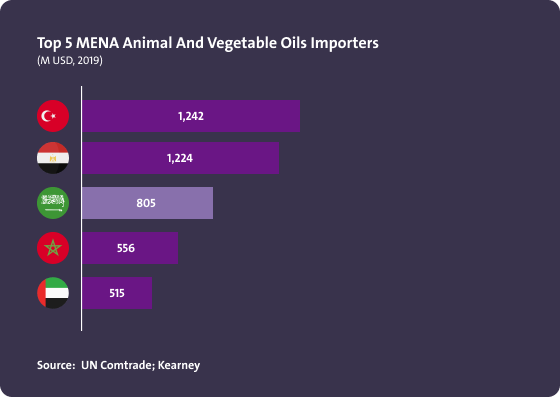
Turkey is the largest importer of animal and vegetable oils in the region.
Top 5 MENA Animal and Vegetable Oils Exporters
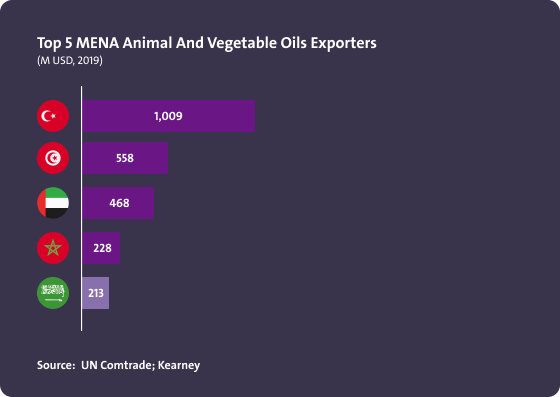
• Regional countries have limited competitiveness in oils.
• Export markets for KSA are Jordan, UAE and Netherlands.
Top 5 MENA Beverages Exporters
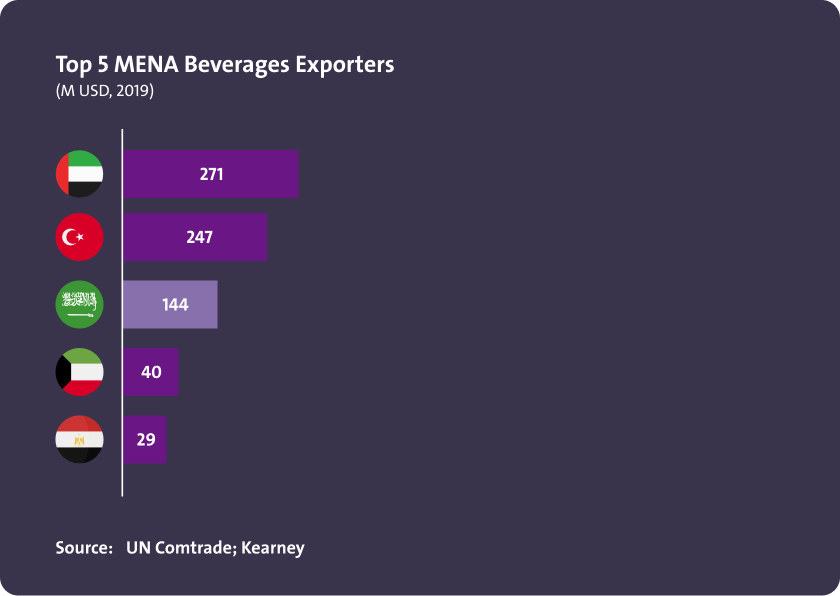
• The UAE and Turkey are competitors to KSA in the regional market.
• KSA is a key player in the regional beverages market with the UAE being its main competitor.
• Jordan is a significant export market for KSA.
Top 5 MENA Beverages Importers
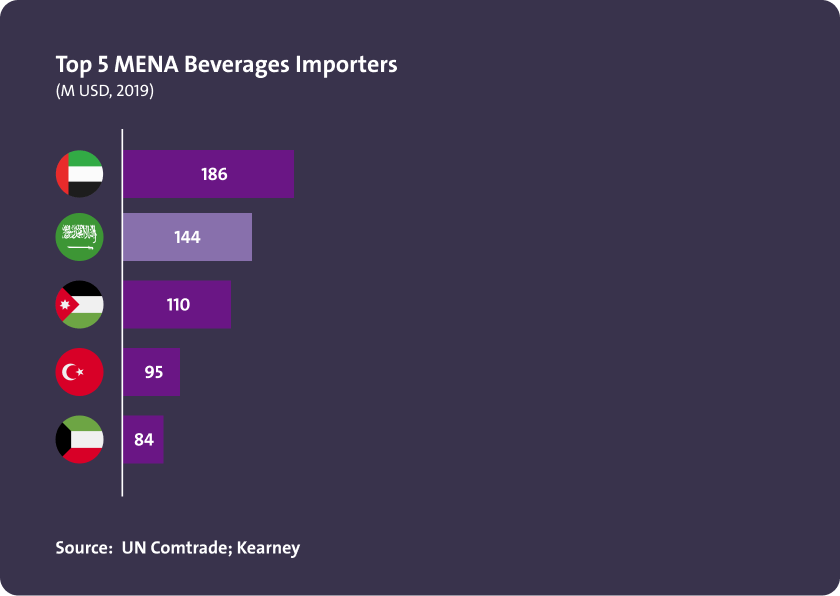
KSA has significant imports originating from Kuwait.
MENA Food and Beverage Market Size

• The MENA F&B market was valued at 276 billion USD in 2019 and is expected to grow at a CAGR of 7% until 2030.
• Confectionery and starch products is the largest market segment with highest expected growth by 2030.
• Turkey is the top exporter of confectionery and starch products ($5.5B in 2019 vs. $898M in KSA).
• Morocco is the top exporter of seafood ($2B in 2019 vs. $141M in KSA).
Local Filter Coffee Market Size (Ton)

Comparison Between The Demand for Coffee or Tea Makers (Tons)

Total Imports of The Coffee Market (Tons)

Imports of Coffee by Country

Local Coffee Market Size

Local Future Demand for Coffee Market

Global Kombucha Market Summary (SAR)

Forecast Of Future Demand of Kombucha Beer

Global Nutrition Drink Market size

Global Nutrition Drinks Imports

• India leads in volumes imported with sizeable 21% share from imported volumes, followed by Denmark, USA and Spain at 16%, 14% and 11% respectively.
• While India leads on import volumes, value of imports is led by Denmark for 21% of imported value, followed by USA, Spain, New Zealand and France at 20%, 6% and 5% respectivly leaving India to rank 7th on value of imports
Nutrition Drinks Import

Global Nutrition Drinks Volume Shares By Brand In 2023

Global Nutrition Drink Market Size

Production VS Consumption for Several Food Value Chains

KSA Tomato Paste and Sauce Market Revenue

KSA Packaged Potato Market Revenue

KSA Date-based Confectionary Market Revenue

KSA Confectionary Market Revenue

KSA Refined Oil Market Revenue

The data and information provided through Daleel platform are for indicative purpose, the provided data and information can be assessed further and analyzed as part of the feasibility studies. In addition, following are other key sources of information that can be used for business case development.
Key Sources for Data

National Geological Database
Reliable national geological and topographic data repository for the whole kingdom of Saudi Arabia including geological and topographic maps, Mineral Occurrences Documentation System (MODS), geochemistry and geophysics data, borehole data, surface samples data and more.
Invest Saudi
For information about investment opportunities in the kingdom to both foreign and domestic investors, as well as private sector businesses please visit Invest Saudi
Tariff Rates and Data
Through the website of the Zakat, Tax and Customs Authority, you can find the tariff rates and data for all kinds of products.
Import Data
Through the website of General Authority for Statistics, you can find detailed data on Import Statistics for all kind of goods.
Export Data
Through the website of General Authority for Statistics, you can find detailed data on Export Statistics for all kind of goods.
Factories Directory
The Factories Directory is provided by the National Industrial Information Center to enable the user to inquire about factories in the Kingdom by activity, production and location, in addition to other data and information.

Ministry of Economy And Planning
A unified platform to present and analyze the latest economic and social the kingdom and its regions in visually interactive ways that facilitate understanding of the Saudi economic landscape.